Your Linux computer typically understands everything happening within it, but it doesn't usually explain things to you in a way that's easily understandable. You can fix this using monitoring tools. However, most of them feel like they're built for an ops team.
Finally, I got to see my computer's vitals in a way that was beautiful and inviting when I used Dashdot. It's the monitoring tool I'd recommend if your machine feels like a black box.
A better-looking Linux system monitor
It has automatic detection of CPU, RAM and storage
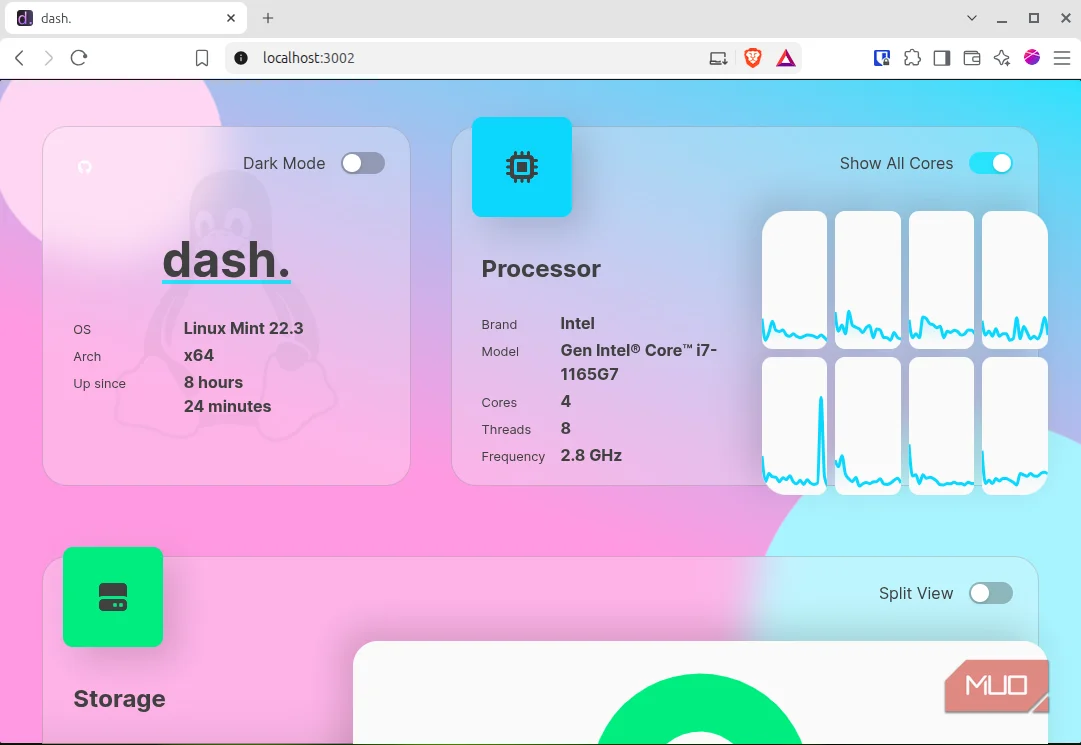
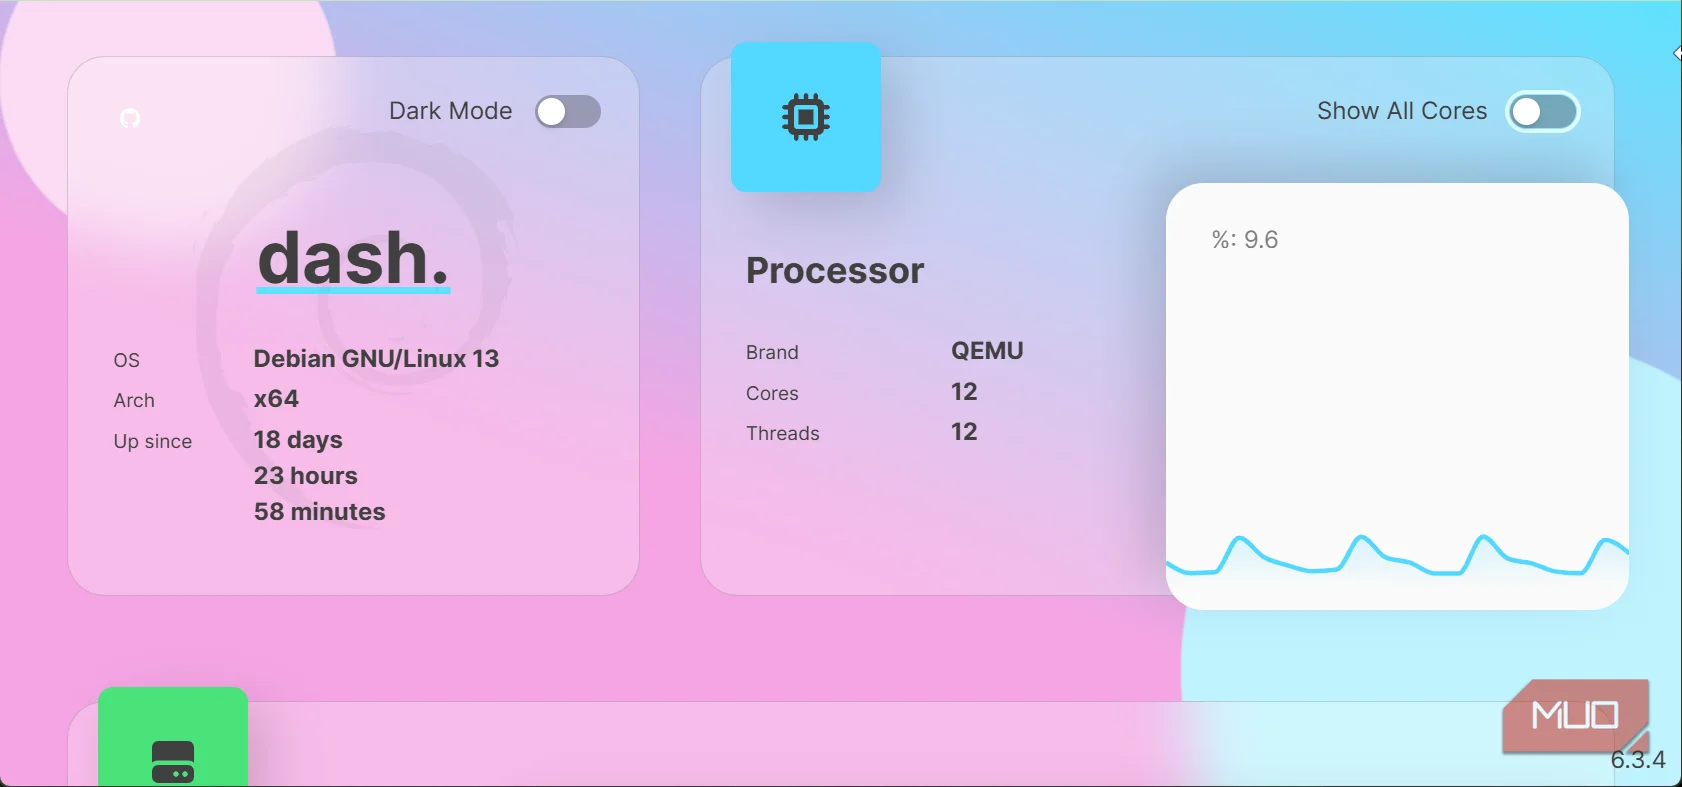
The screenshot above is probably the best argument for Dashdot. It shows eight small CPU graphs that are mainly flat. It's what you expect a healthy machine to look like because it spends most of its time doing nothing particularly interesting. Dashdot found a way to make that appealing to the eyes.
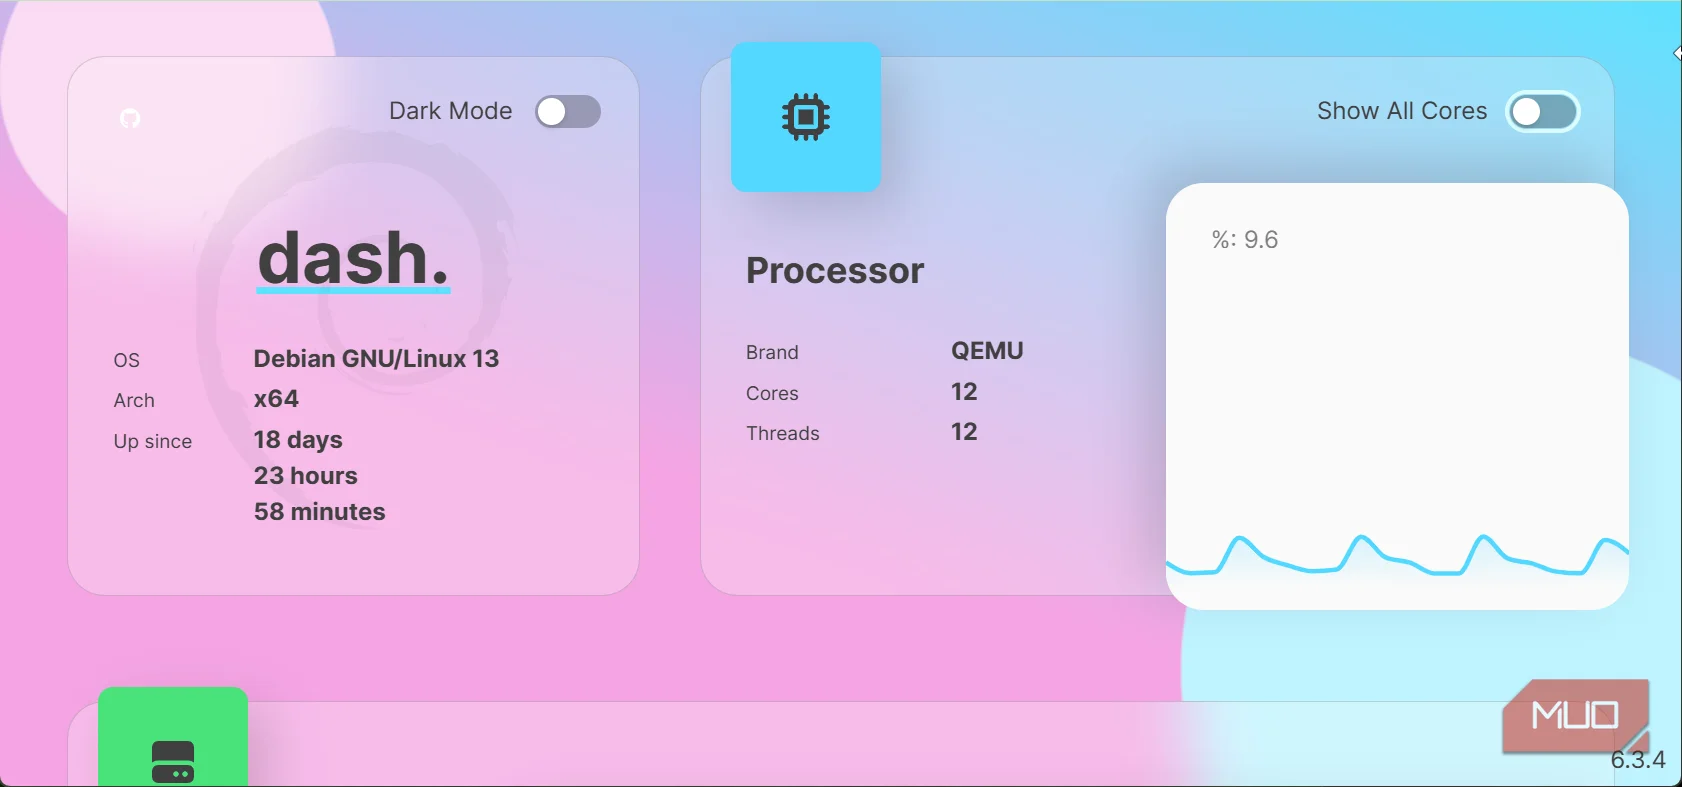
Its interface consists of translucent cards sitting over a pink-to-blue gradient. Each tile has a bright icon that stands out, and the first sits above a faint Linux mascot and bears the OS details.
The brightly colored icons make the tiles easy to tell apart, and the tool looks much different from the Linux monitoring tools I've been accustomed to.
On the Processor tab, the Show All Cores toggle is enabled by default, splitting my CPU card into one graph per logical processor, eight on my i7-1165G7.
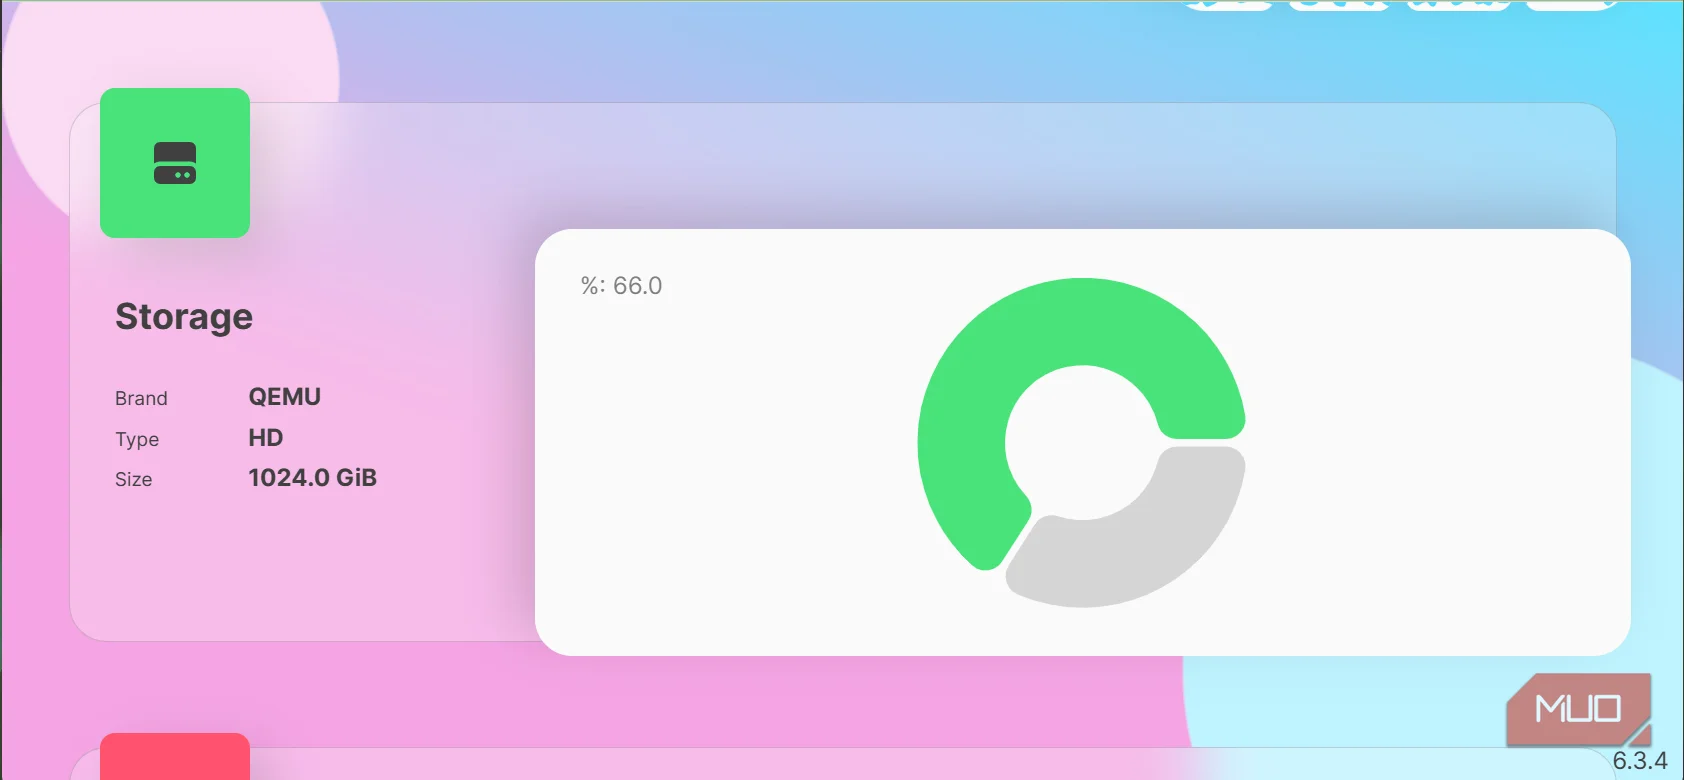
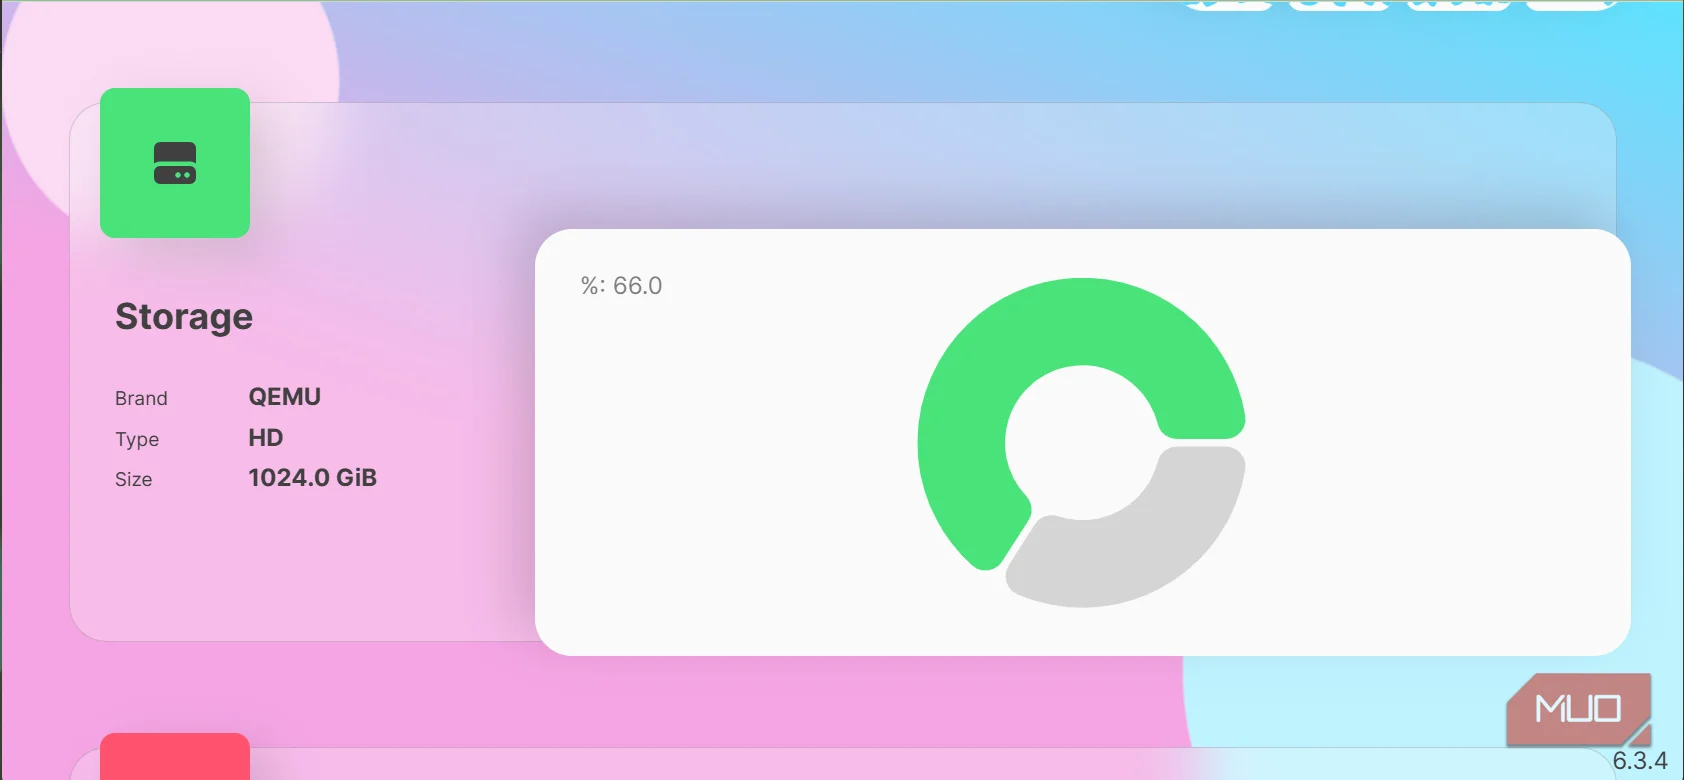
The storage card surfaced my 256GB Western Digital NVMe SSD and my 1TB Seagate HDD without any configuration. It showed the 1TB HDD as about 931.5GiB, but this is understandable since the OS counts binary units while drive manufacturers count a terabyte as a trillion bytes.
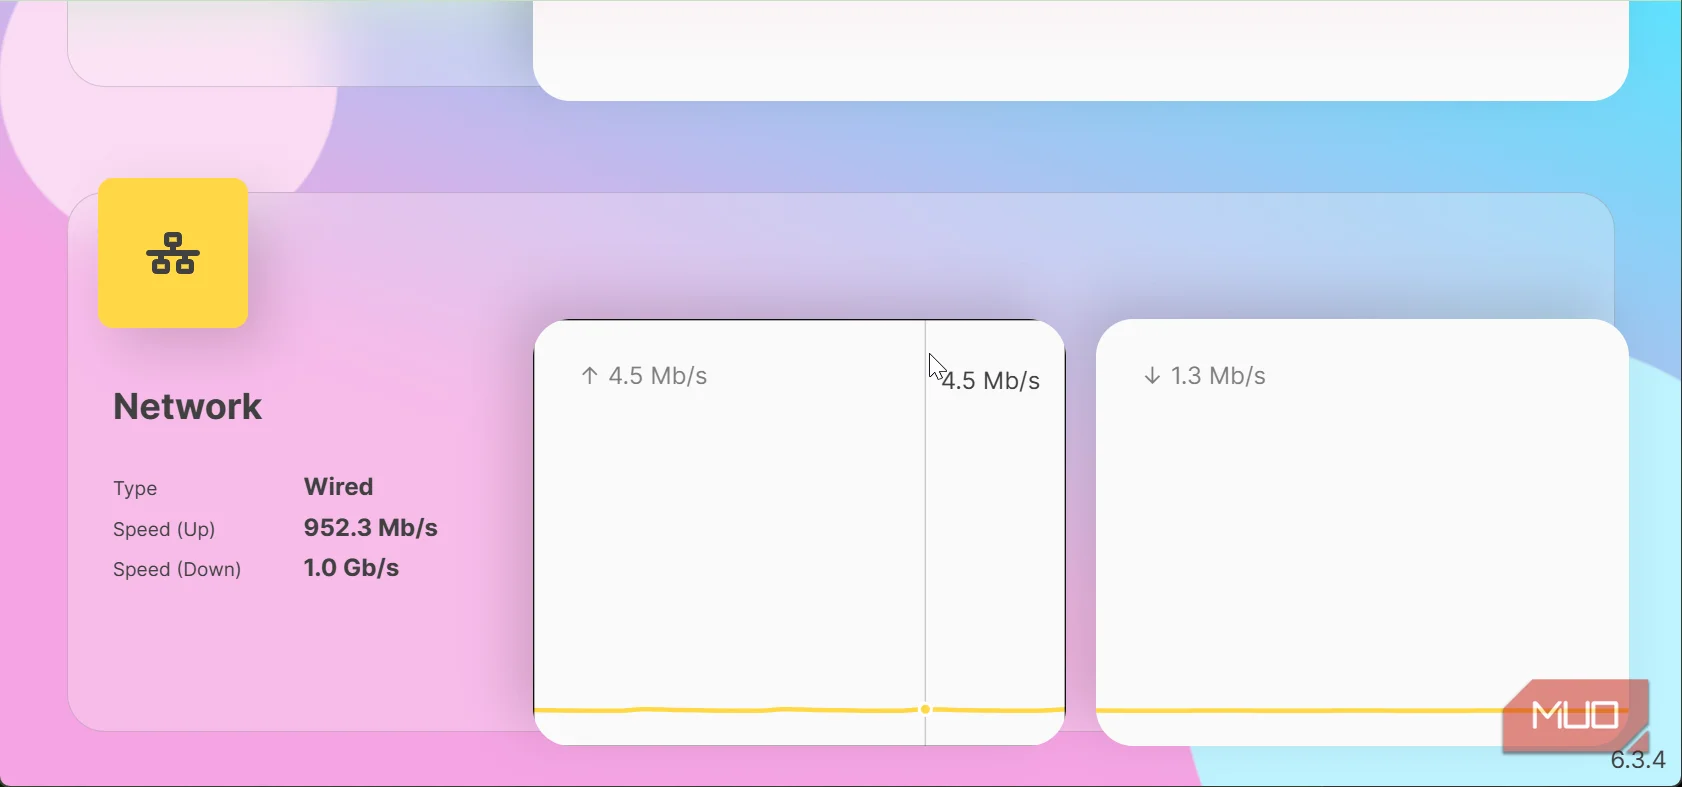
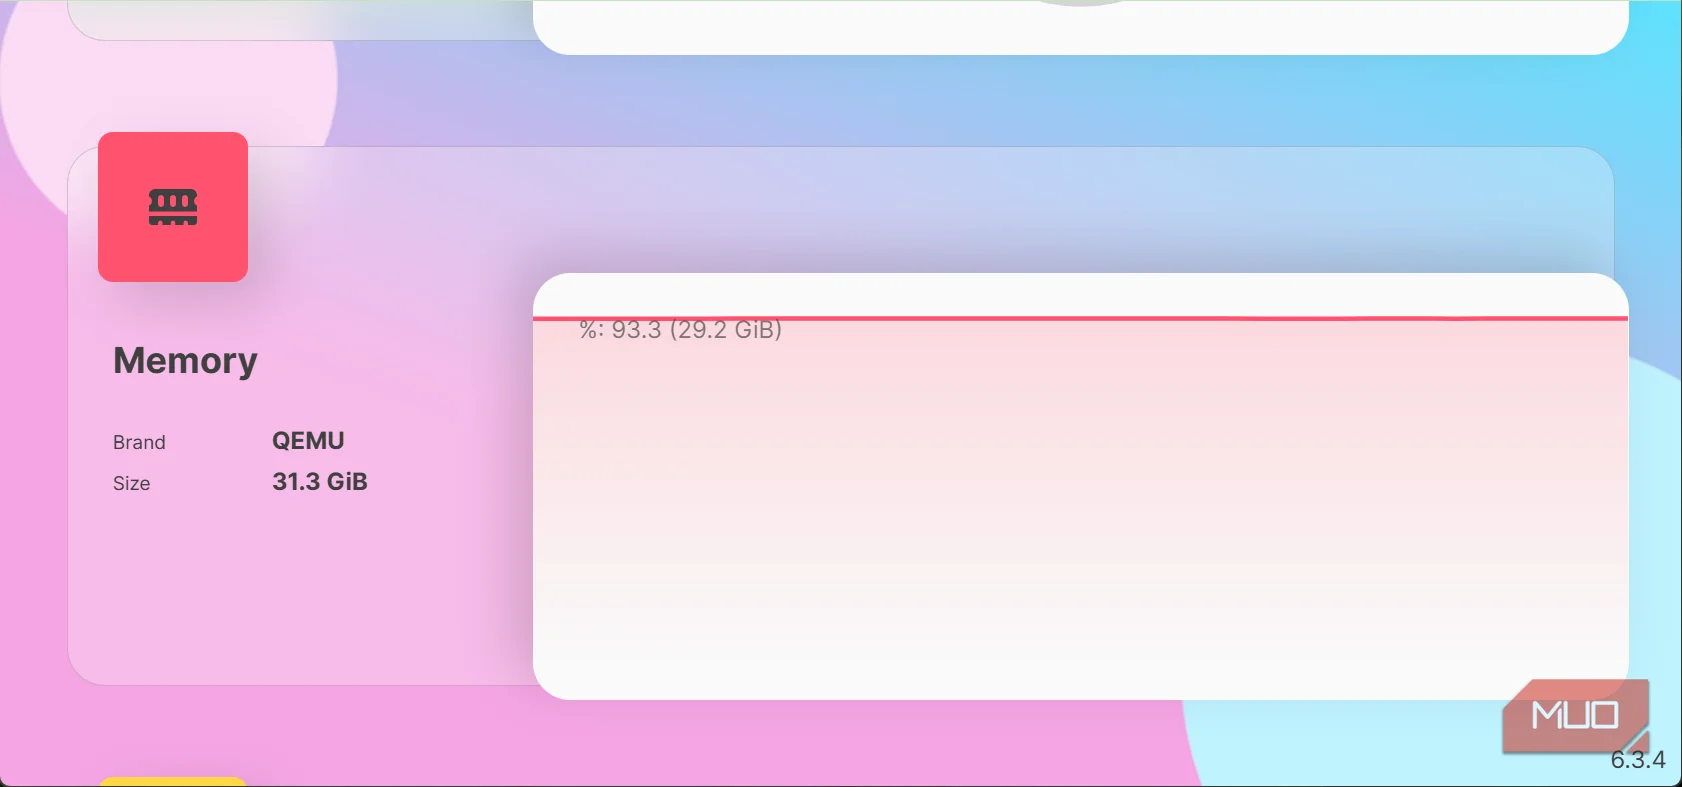
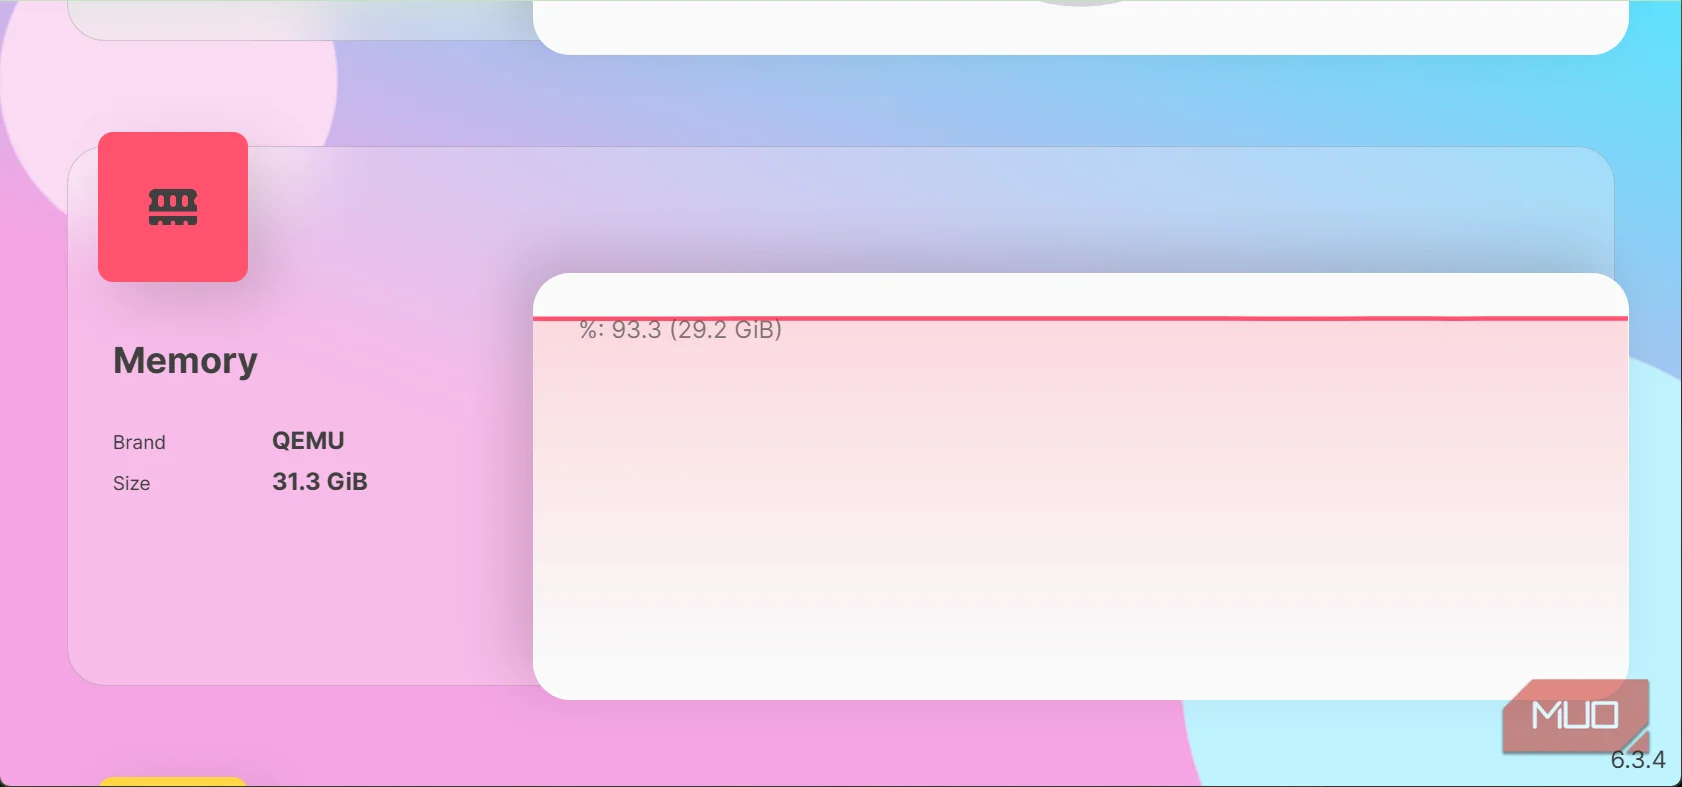
However, what was more appealing was how much it worked just on its own. Without configuration, it surfaced my Samsung DDR4 memory, down to its 3200MHz speed, as well as my computer's wireless interface. It read all these details straight from the host.
Free Linux monitoring in Docker
No subscription or cloud account required
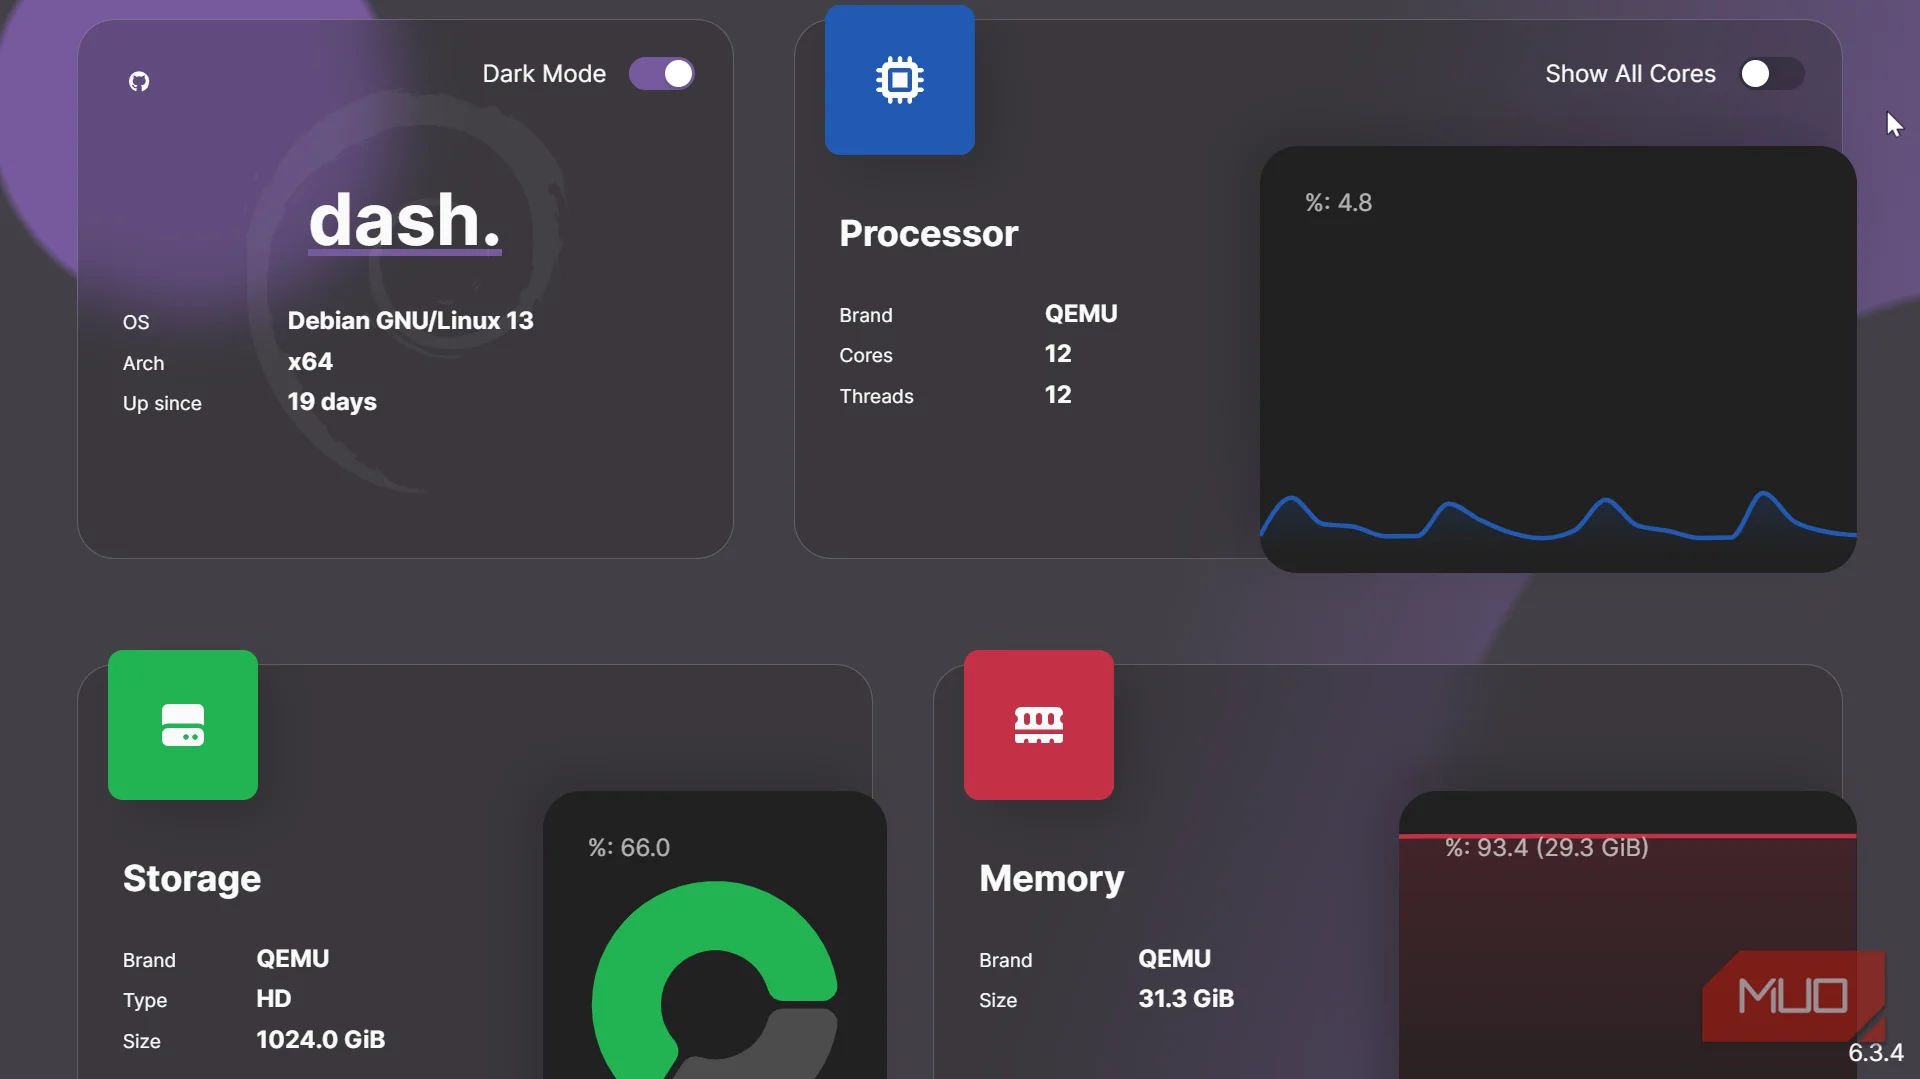
The most boring part of the tool was setting it up, and I found that endearing. Dashdot runs from a small Docker Compose file. This meant I didn't have to configure a database or separately install a monitoring agent — it works from that one file. Docker runs apps from within their own sealed boxes, ensuring they don't scatter files across your computer.
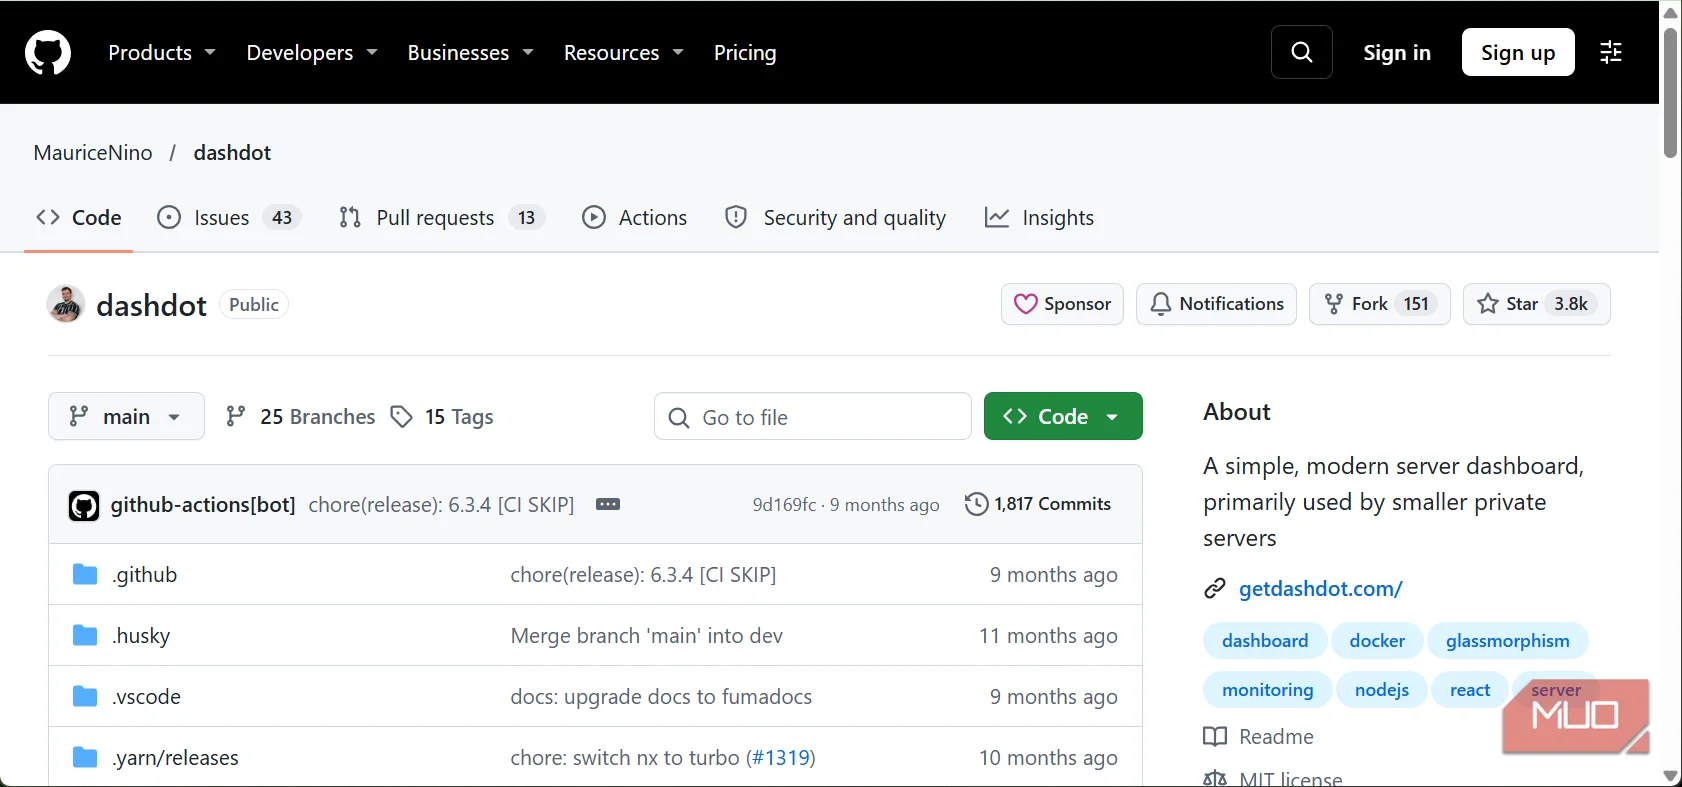
Dashdot is free and open-source under the MIT License. The basic install, which I use, runs on your hardware and doesn't require a cloud account or subscription. I've used a few paid monitoring tools and some of them bill per machine. Datadog, for instance, charges per host per month. Its Pro infrastructure plan costs $15 per host per month. For a single computer, you would be paying around $180 every year.
Dashdot provides prebuilt Docker images for two different processor architectures, AMD64 and ARM, making it a good option for a spare mini PC or even a small board.
Dashdot has security trade-offs
Why its default Docker setup needs caution


I needed only my laptop to open Dashdot's dashboard, so I bound the app's port to 127.0.0.1. While this feels like a safe default, it has one obvious limit: I can't check the dashboard from a different device.
The problem with doing it differently is that Dashdot doesn't have a login screen, and configuring it differently means exposing it to your network. If anyone can reach that page, they'll have access to your system stats. My recommendation is to put a reverse proxy in front of it. This serves as a gatekeeper that requires a password.
Below is the official one-line install published by Dashdot:
docker container run -it \
 -p 80:3001 \
 -v /:/mnt/host:ro \
 --privileged \
 mauricenino/dashdot
The problem with following it as published is that the -p 80:3001 option publishes the port without specifying an address. Depending on your network, router, firewall and other security controls, this may make the dashboard accessible through every network interface.
The second complication may arise if you rely on UFW, Linux's simple firewall management tool. Even if you've configured UFW to block a port, Docker can still make the port reachable since its networking rules can handle traffic to published ports even before the filtering rules apply. You can avoid this exposure altogether by binding the port to 127.0.0.1.
However, privileged: true is still the biggest trade-off in the Compose file. The app uses this flag to correctly read memory and storage information, while -v /:/mnt/host:ro (the read-only mount) gives it access to filesystem information, including drive usage. The mount limits what it can modify. However, every privileged container still has wide host access. It's one trade-off for the kind of automatic detection it offers.
This is why Dashdot is best suited for localhost, and I may not use its official setup for any machine facing the internet.
The limits of Dashdot's monitoring
Dashdot serves a very useful but narrow purpose. On my machine, I have several Docker containers running, but Dashdot doesn't tell me anything about them. I basically use it to see how much CPU and memory my computer is using; it doesn't tell me which container is responsible.
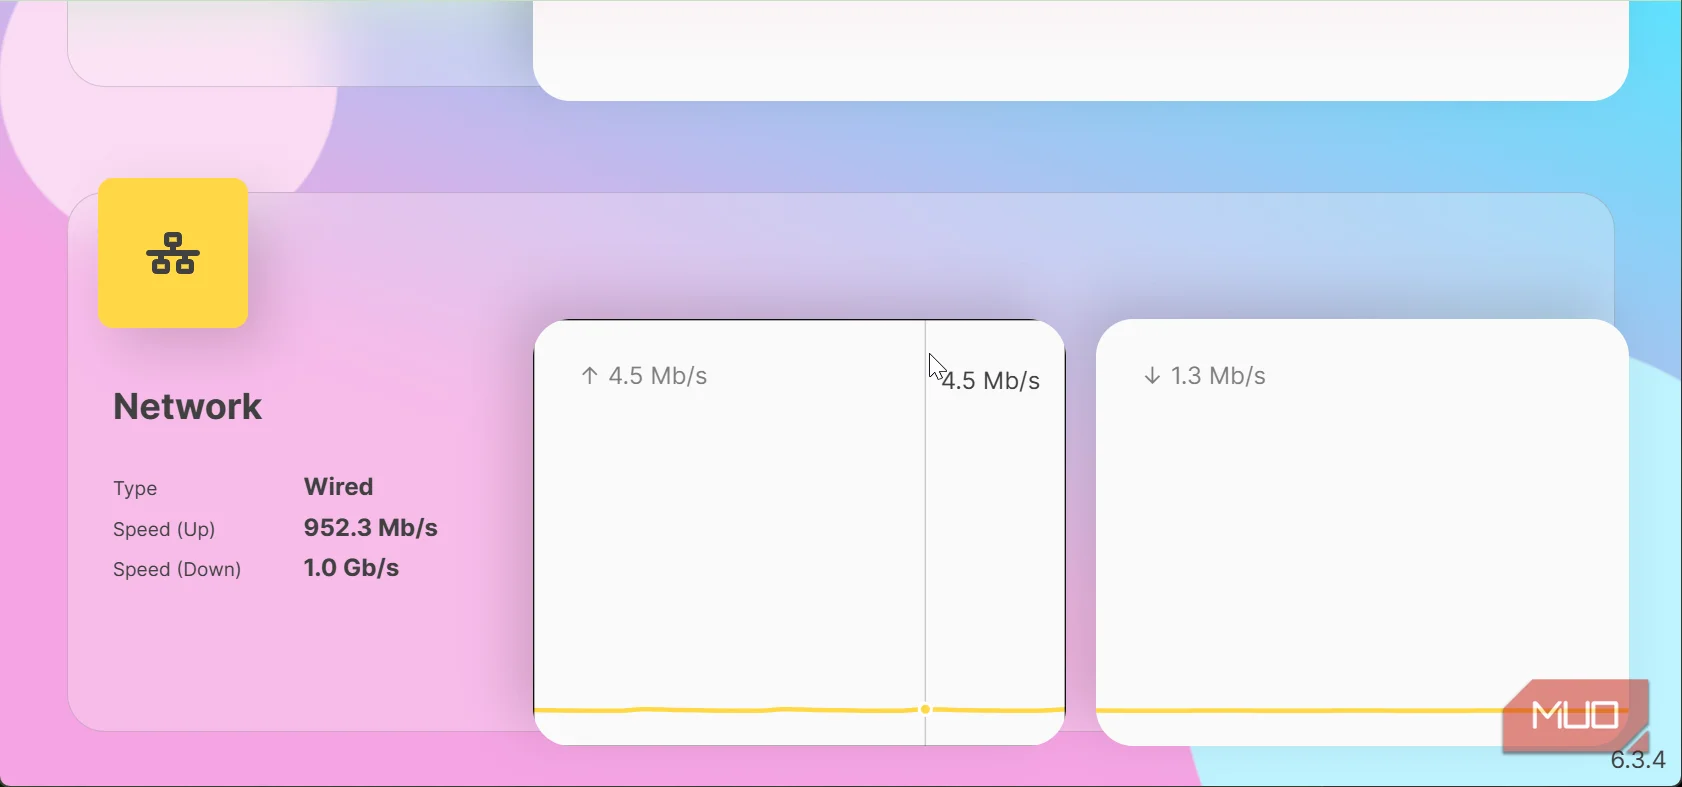
By default, it covers the OS, CPU, storage, RAM and network, with the GPU as an option. None of these metrics looks inside a container. If I see a rising CPU graph, I know something is wrong, but I'll have to look somewhere else for the answer. The paid tools fill that gap. So Dashdot may not be for everyone, but if you like something that is very aesthetically pleasing and efficient at reading your system, it's one worth trying.