When you’re in a hurry, your Google Docs notes often don't follow the structure you want. I put together an Android Doc like that on purpose. Then I had Gemini organize it into an infographic that put everything in order and helped me, as a visual learner, see the bigger picture without the headache of remembering every detail.
I gave Gemini my jumbled notes and a sentence as instructions
It put two decades of Android history in order


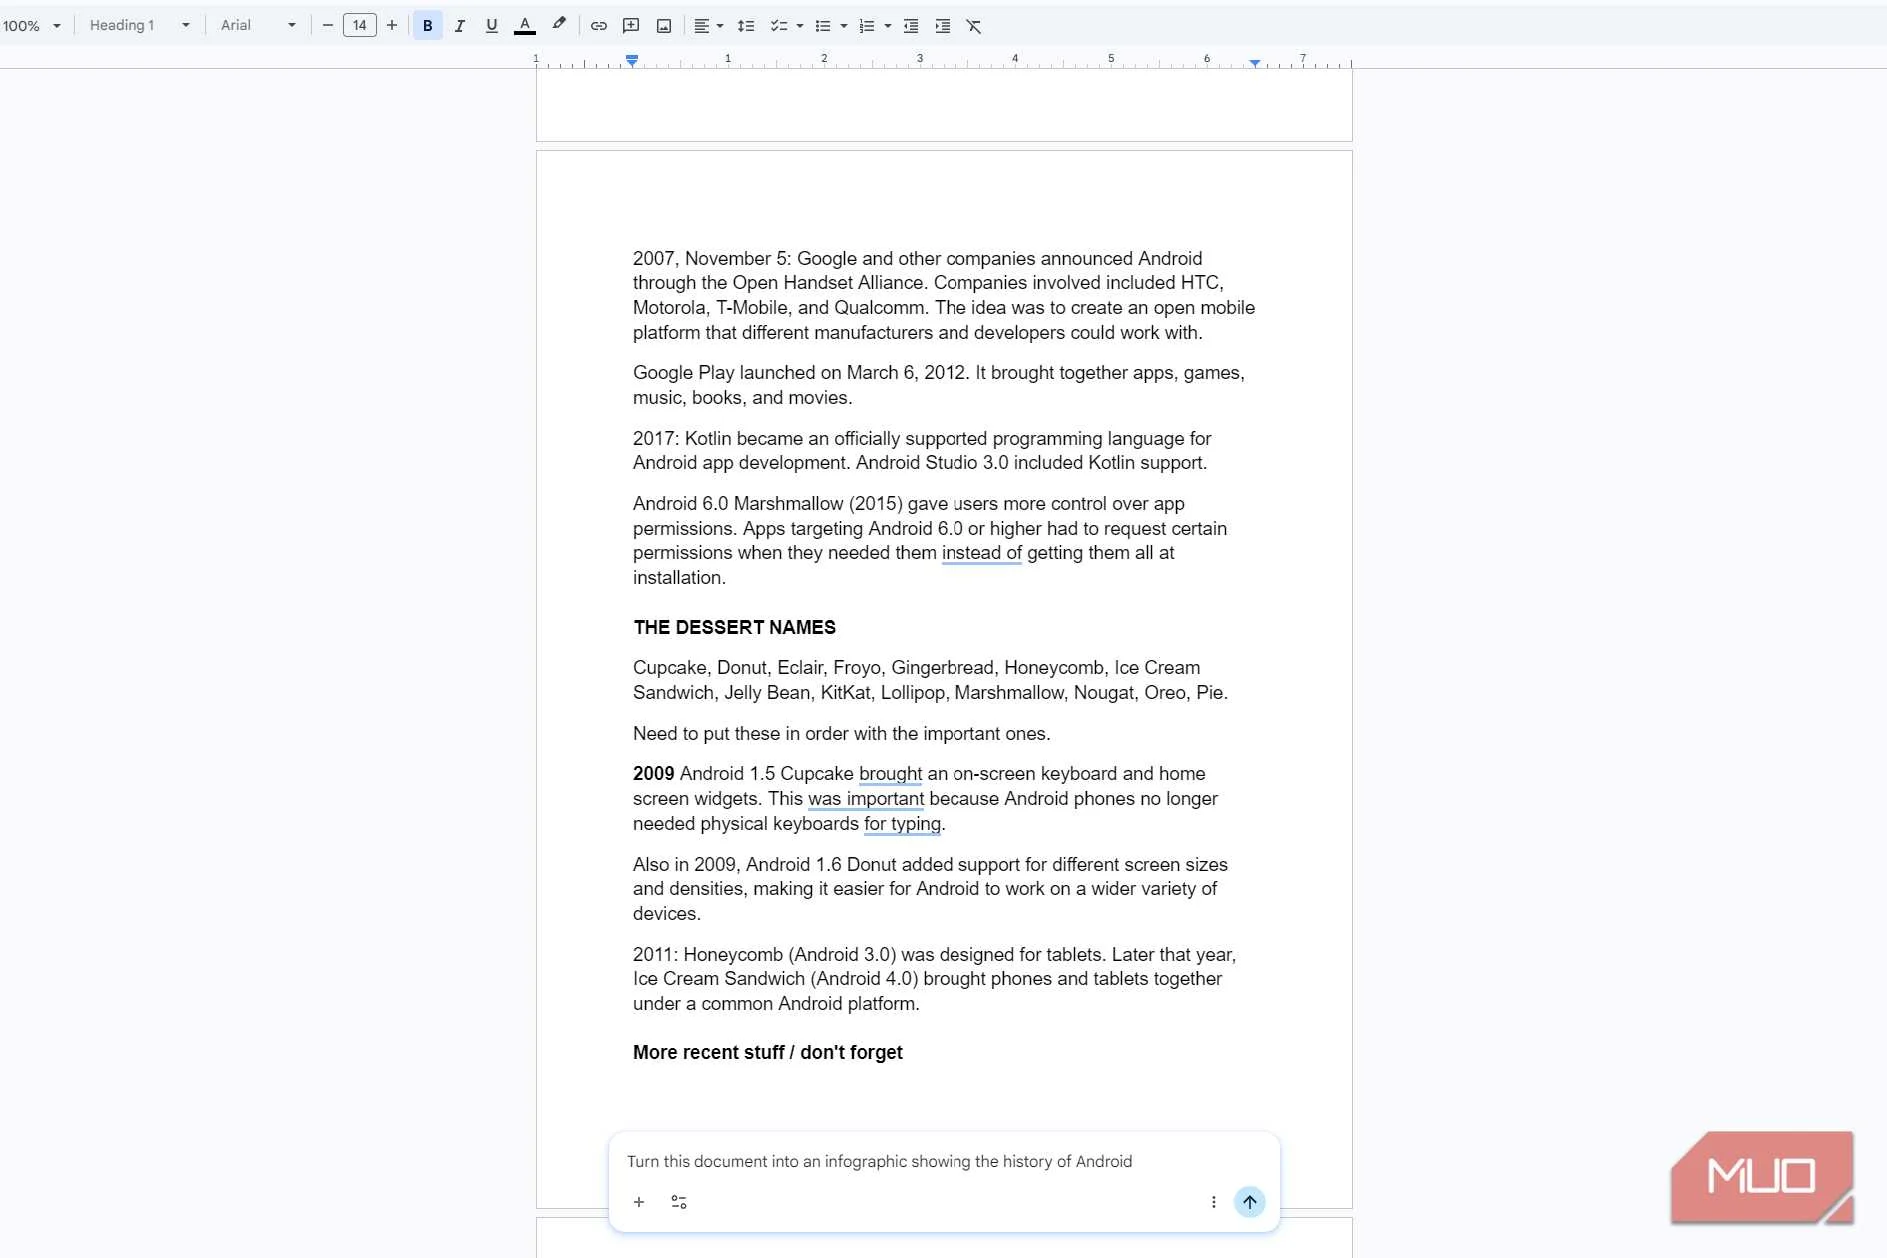
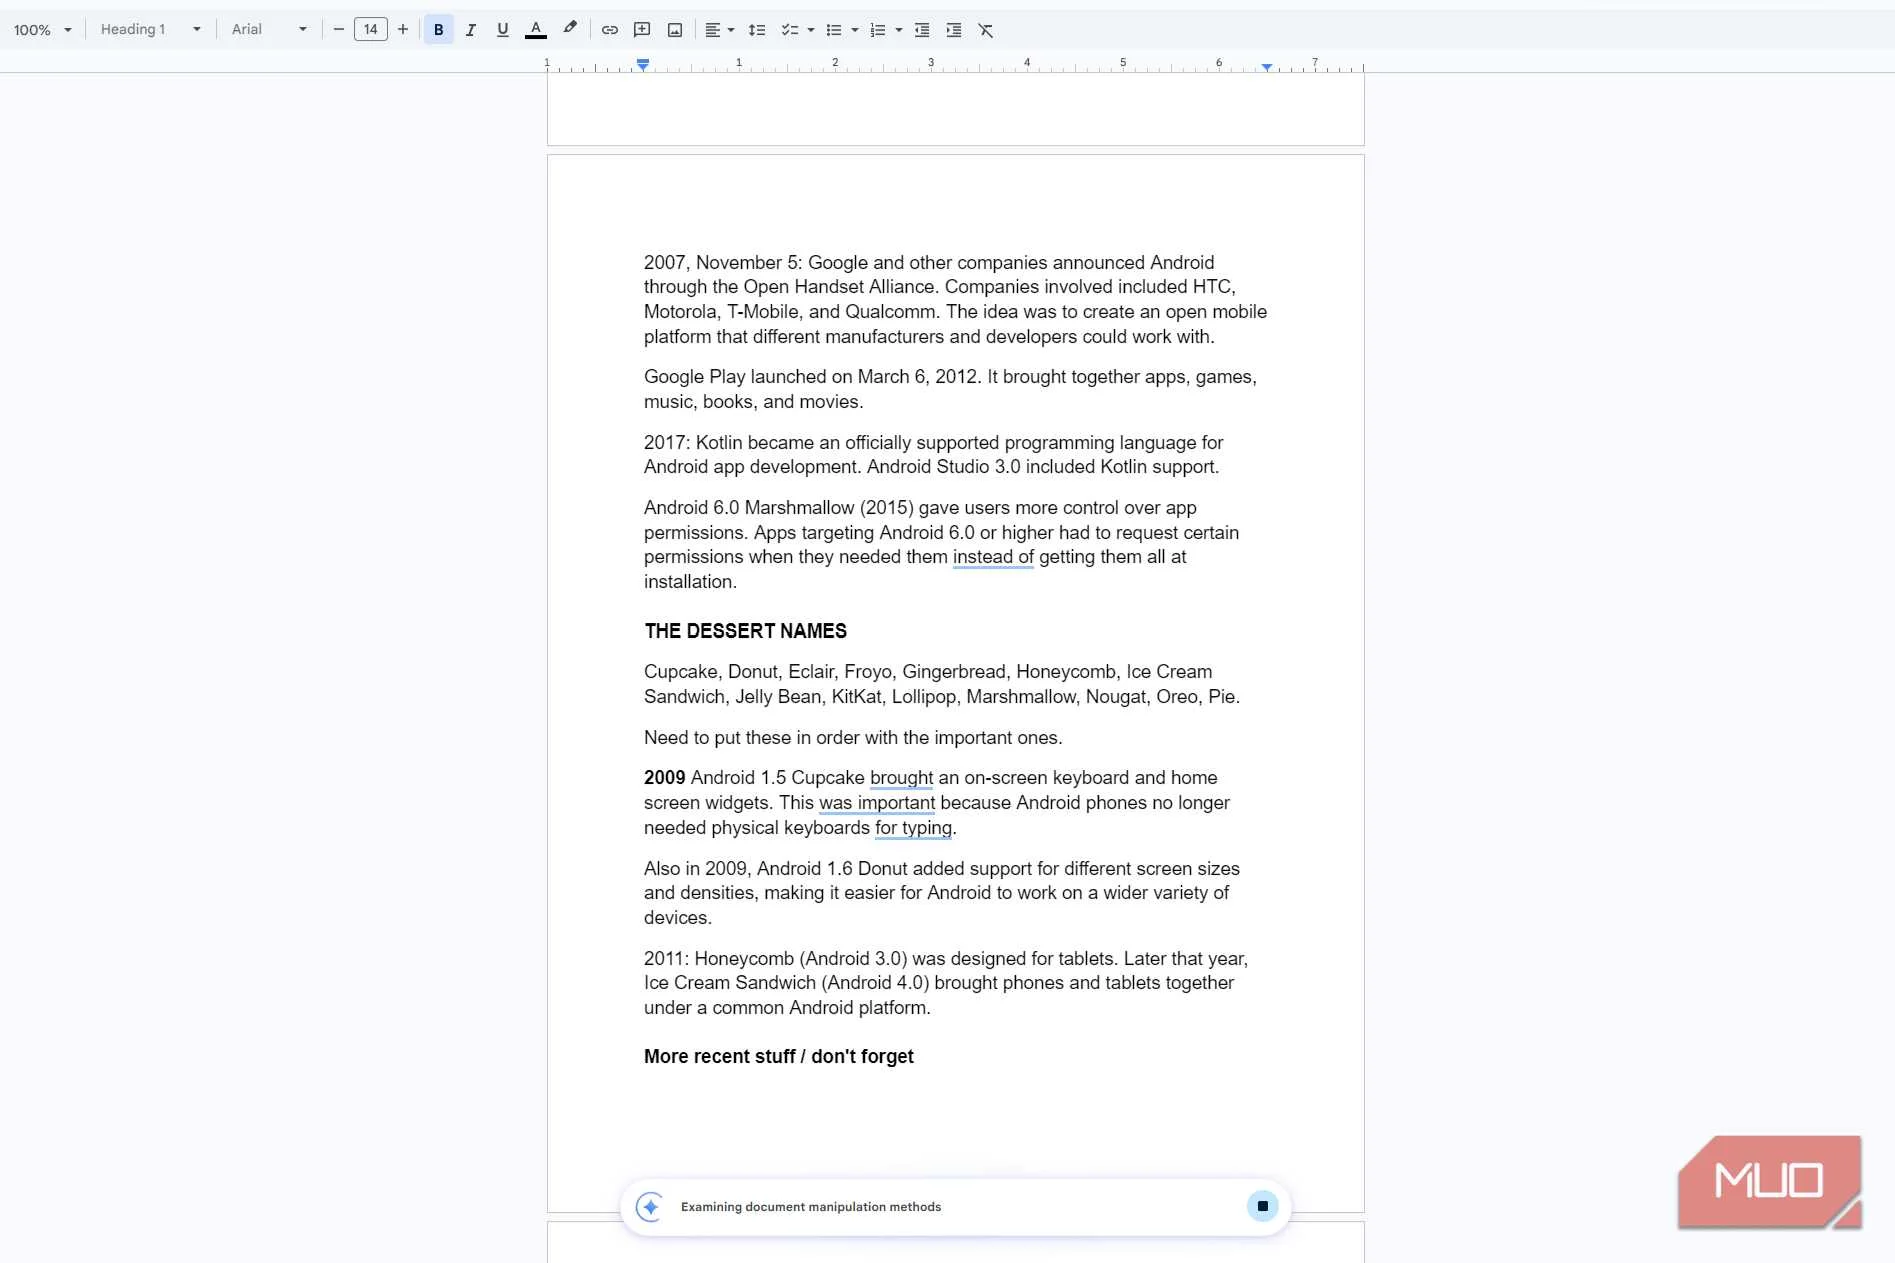
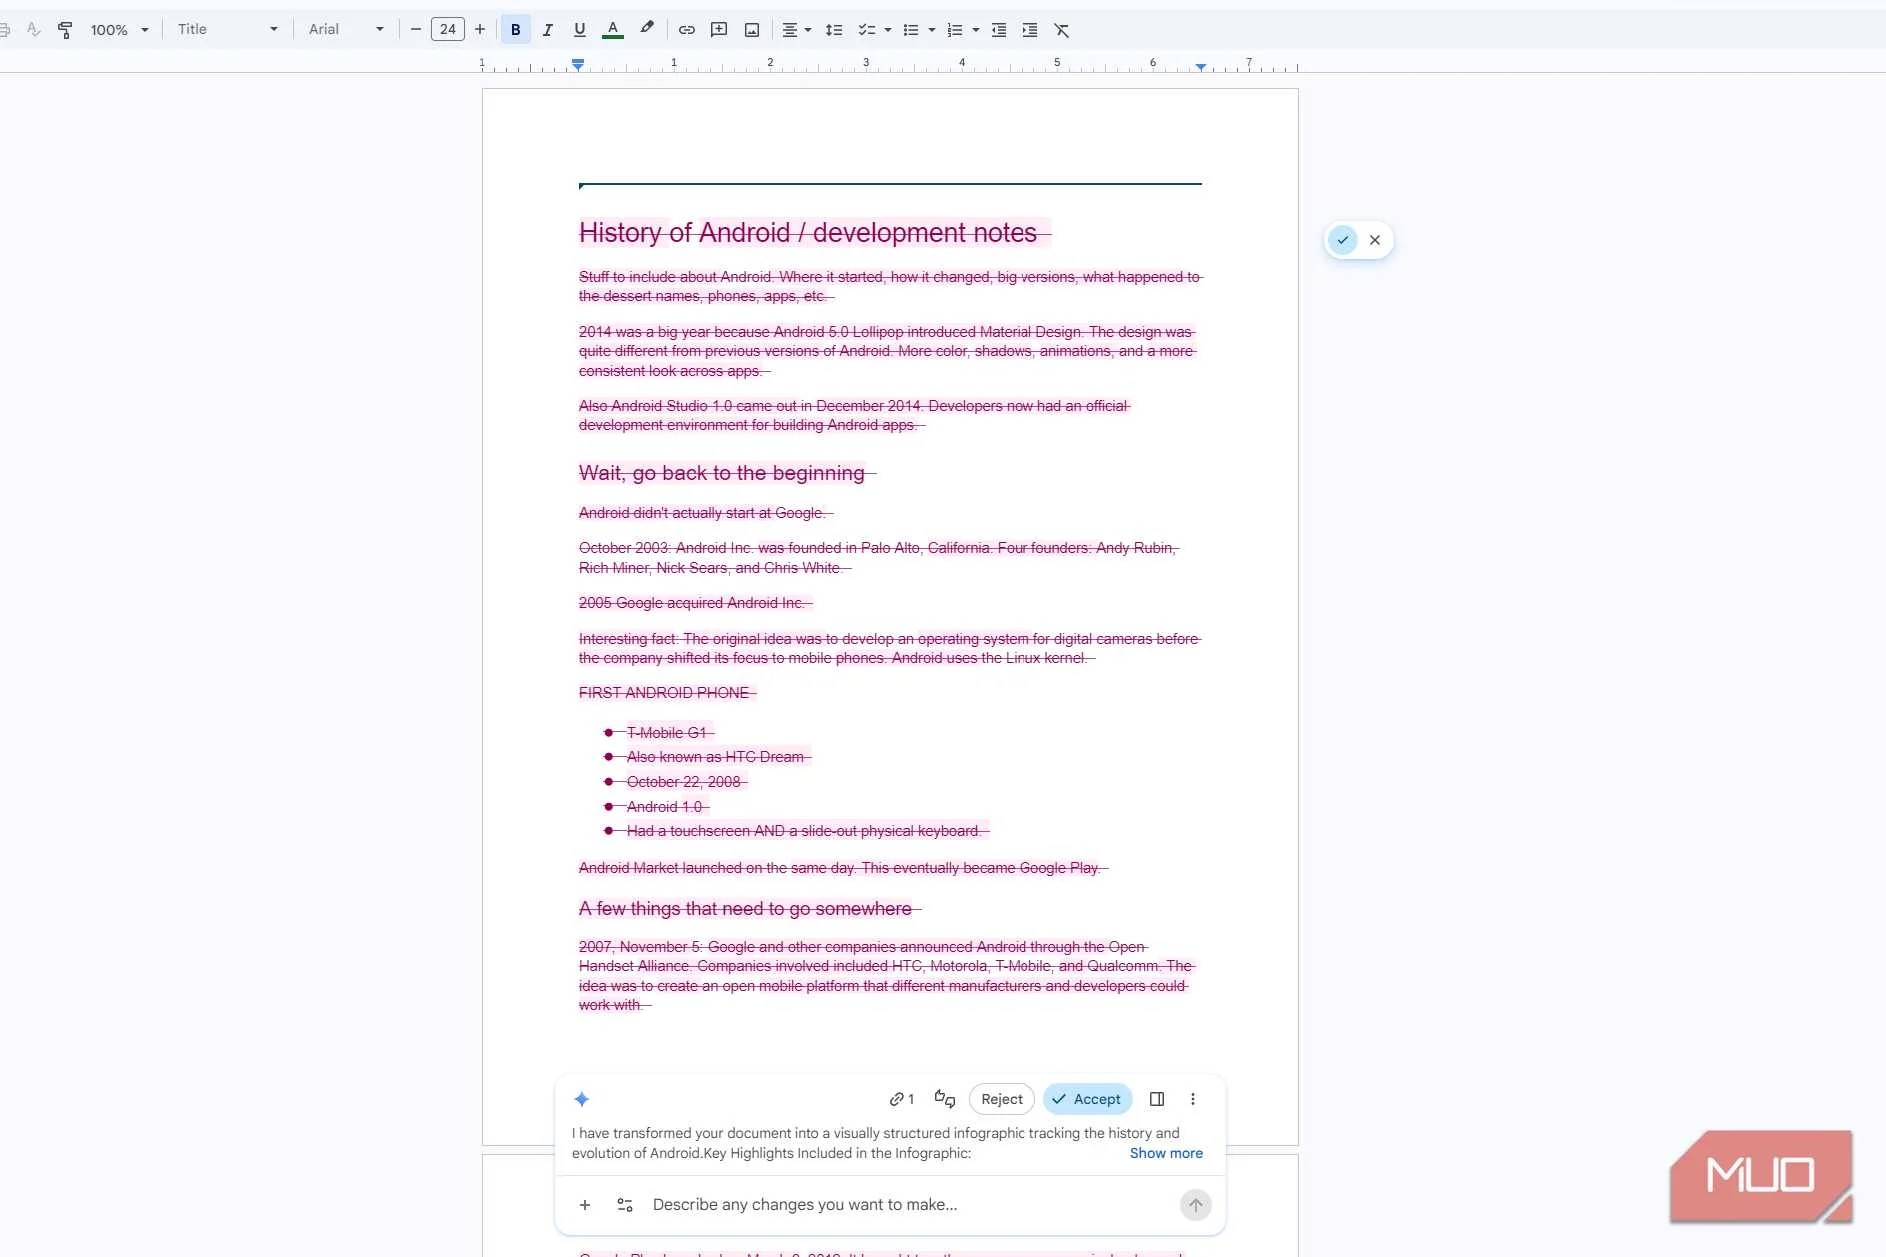
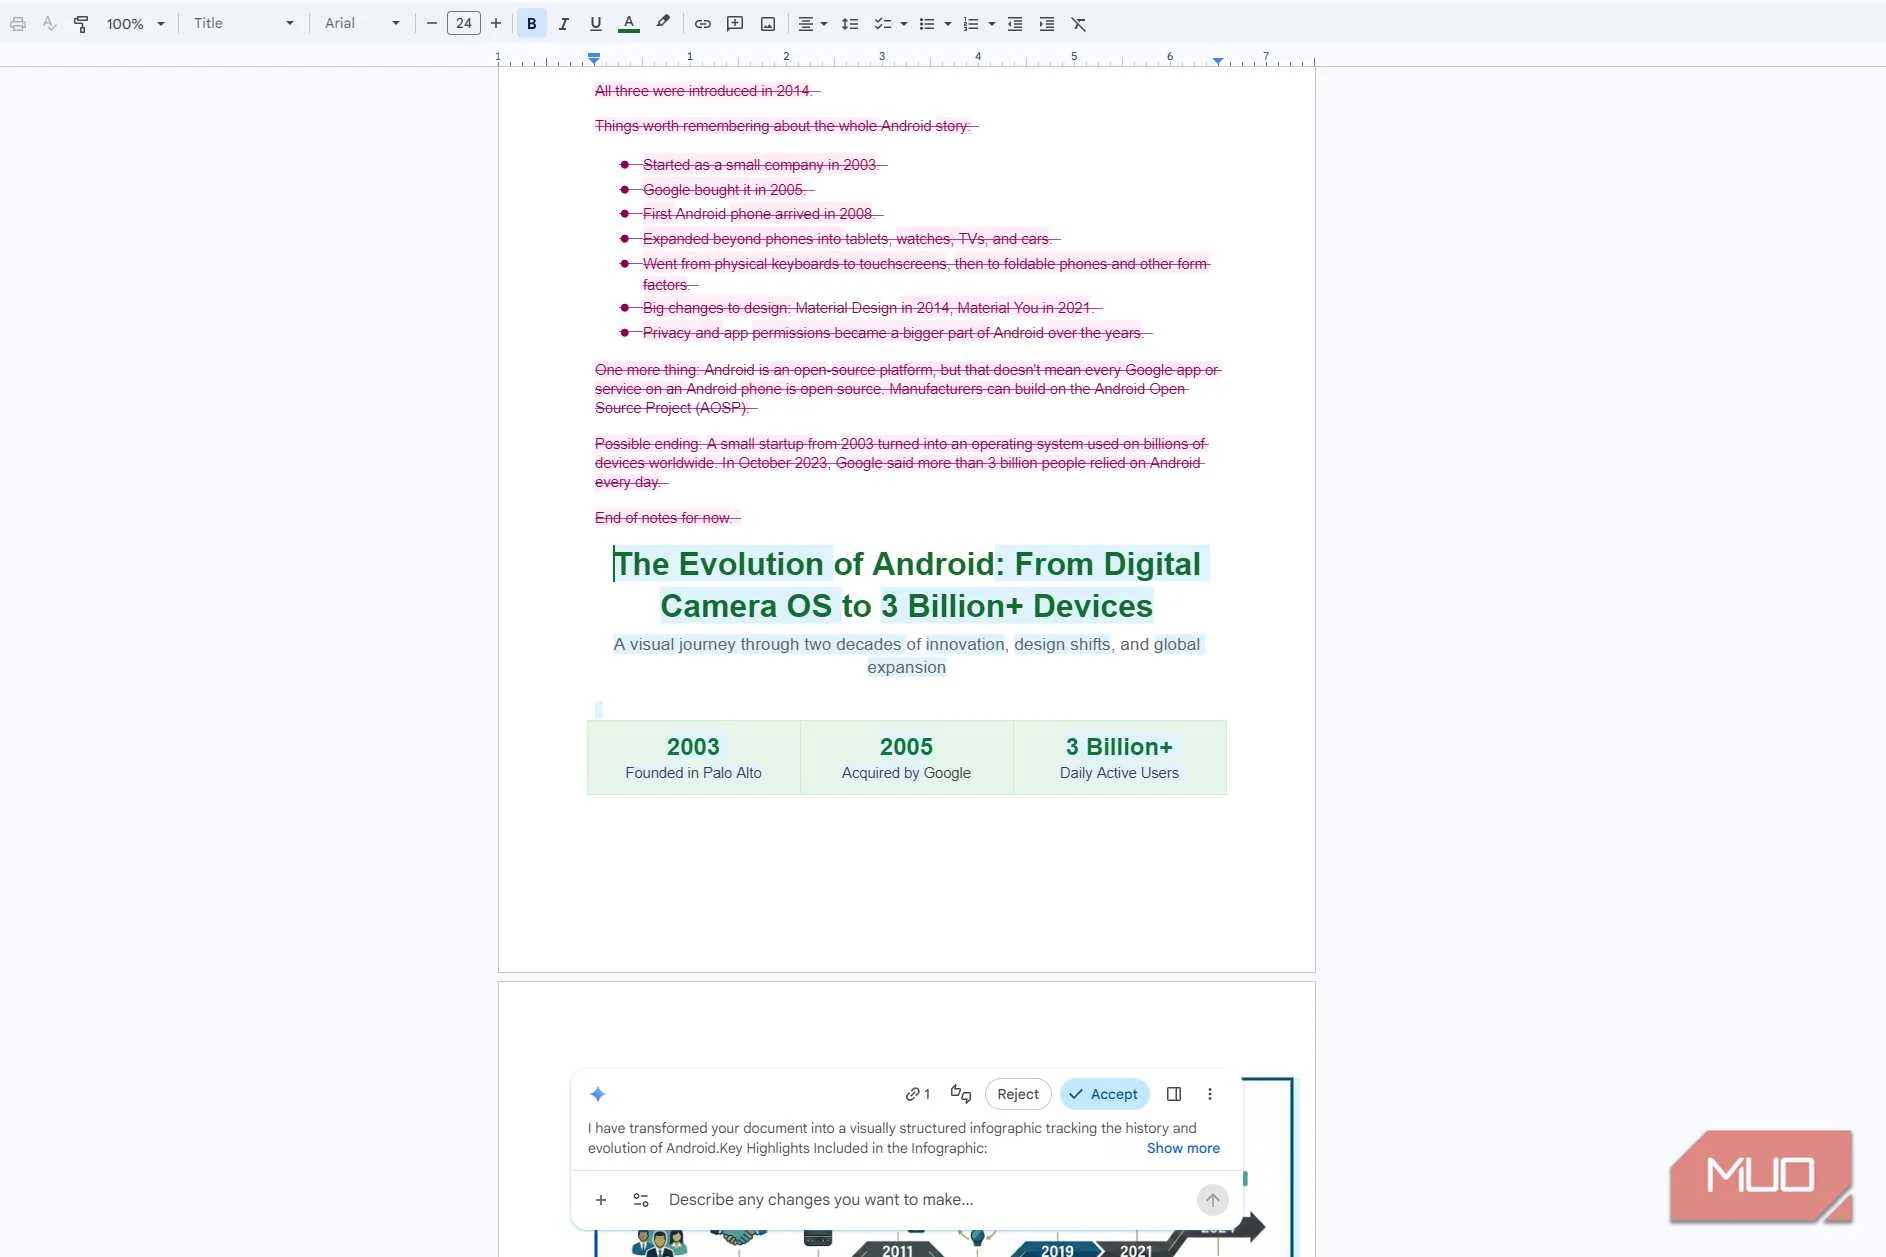
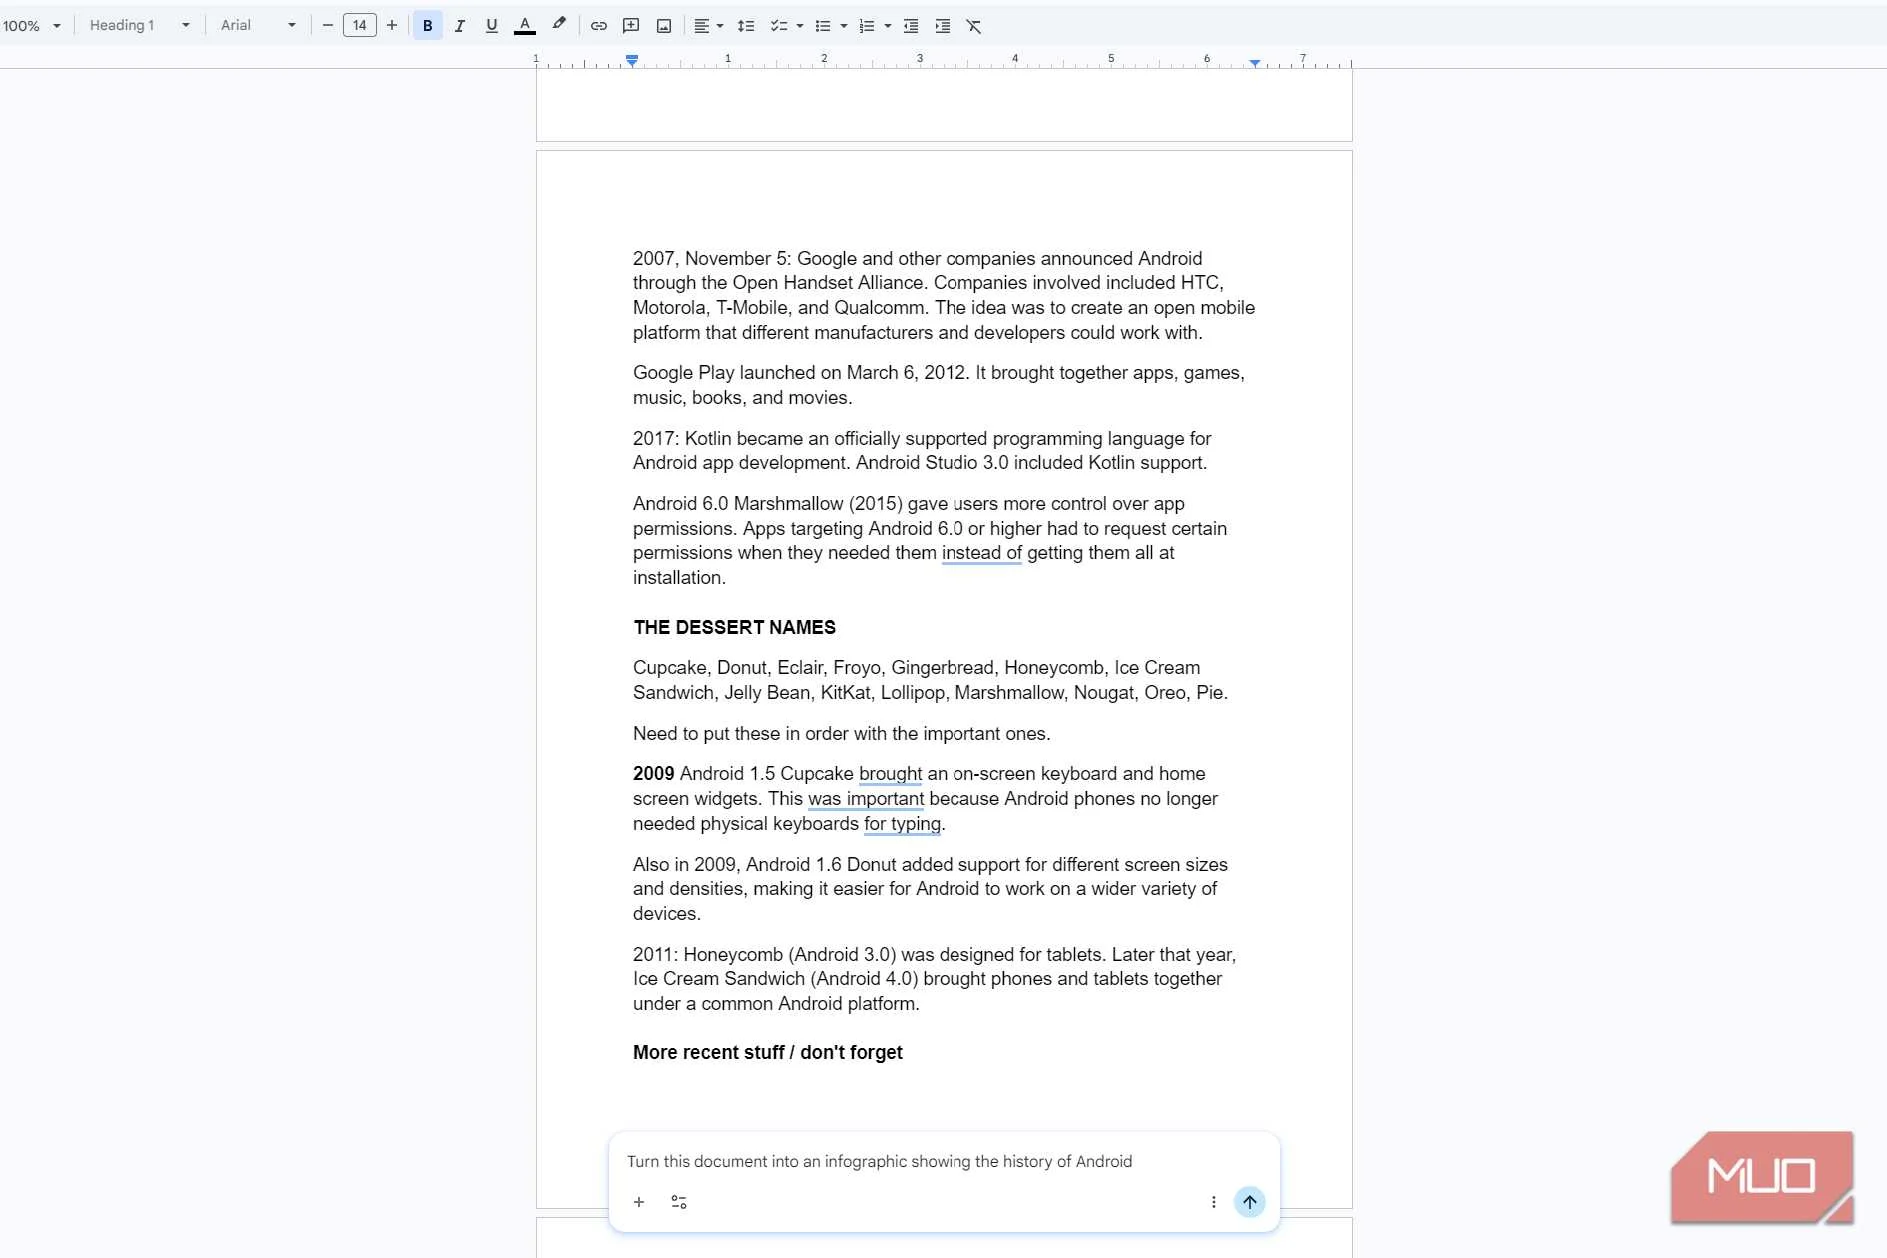
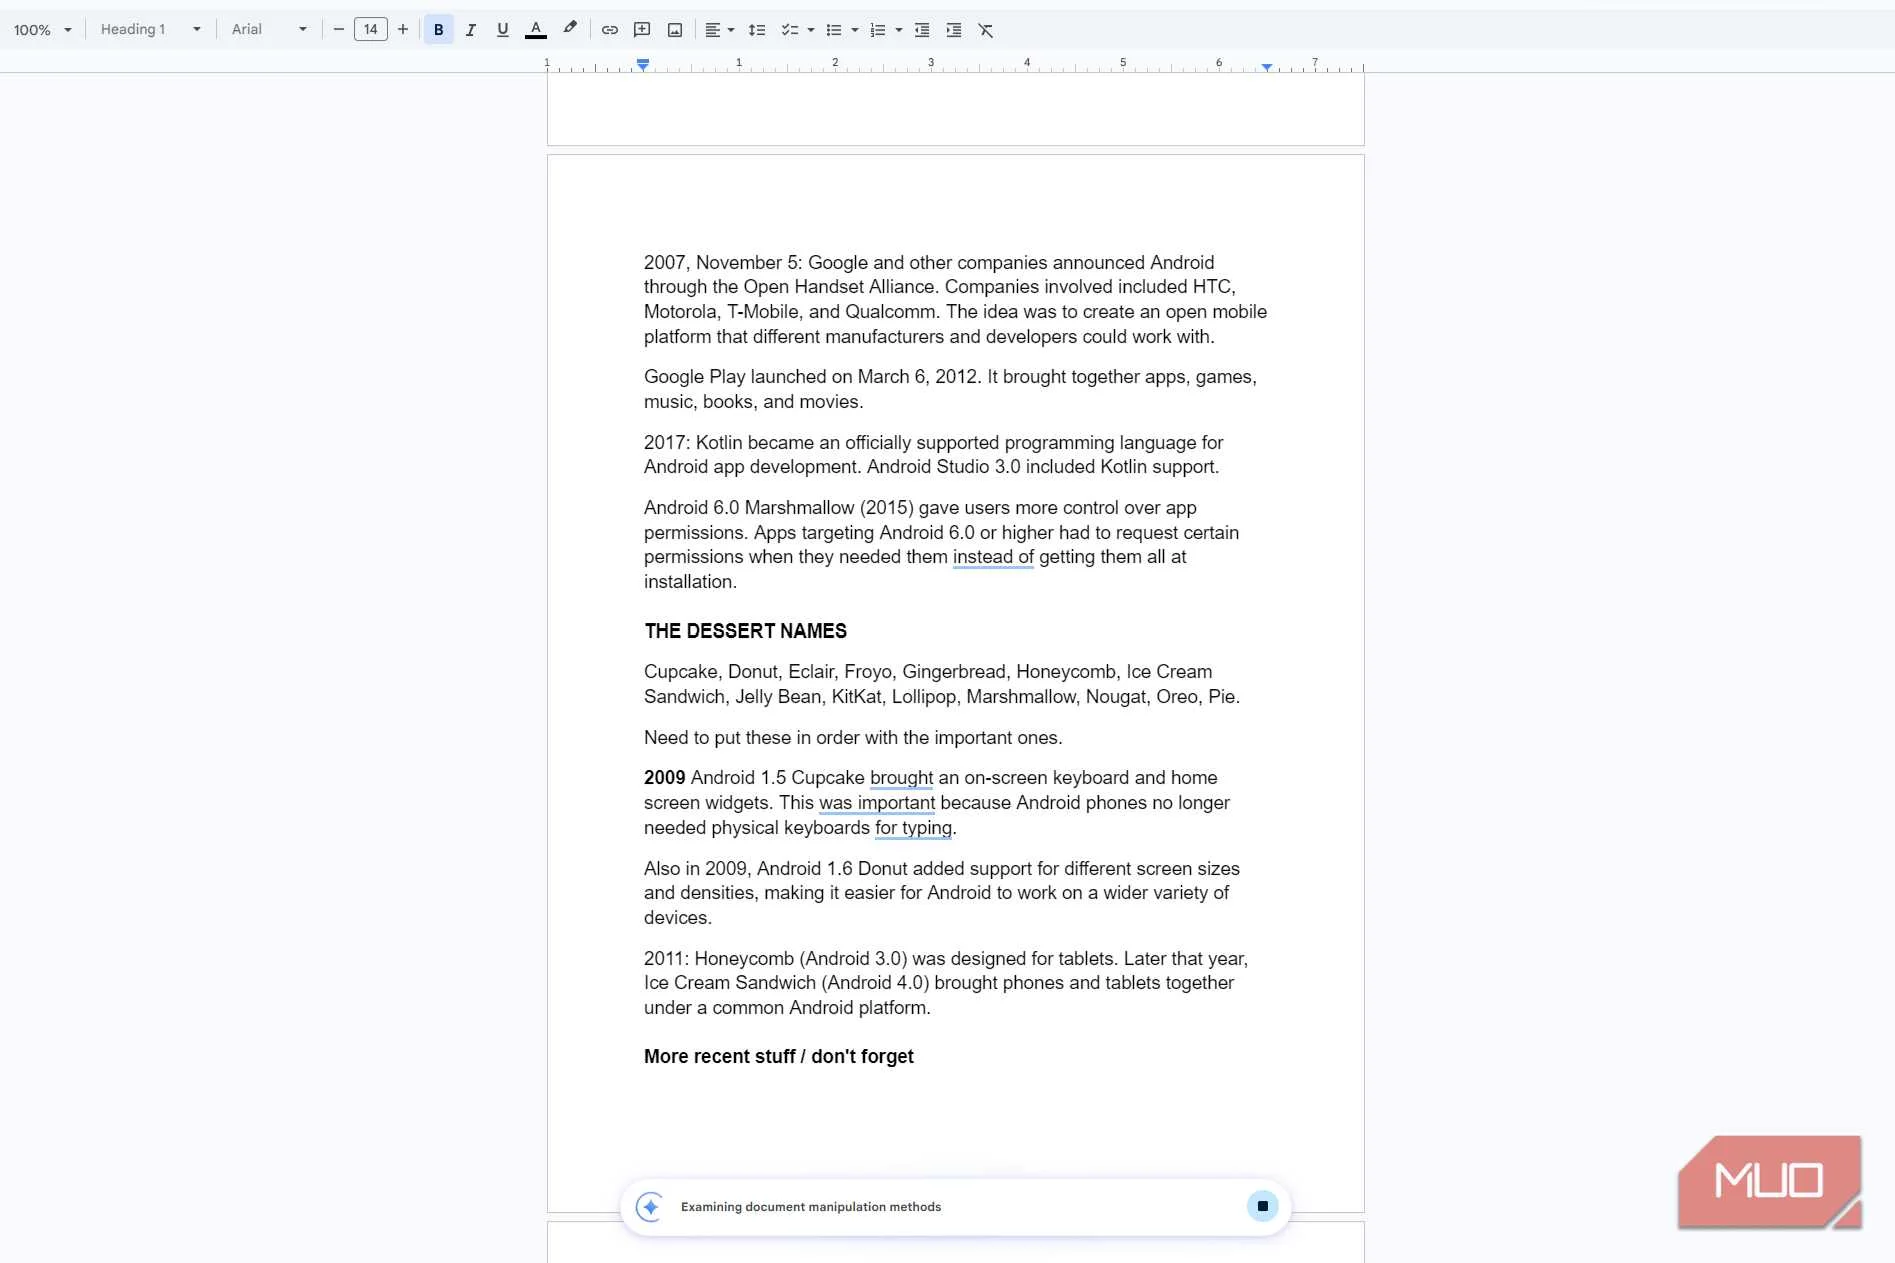
Letting Gemini put your notes in order saves you time and frustration. You don’t have to go back through them and work out where everything goes. If you have a Google AI Pro or Ultra plan, or an eligible Workspace plan, you can do this in Docs on the web. In the bottom bar of my Doc, I clicked the prompt field and gave Gemini a one-line instruction to turn my notes into an infographic. My notes were all over the place, since they started in 2014 and then jumped back to 2003.
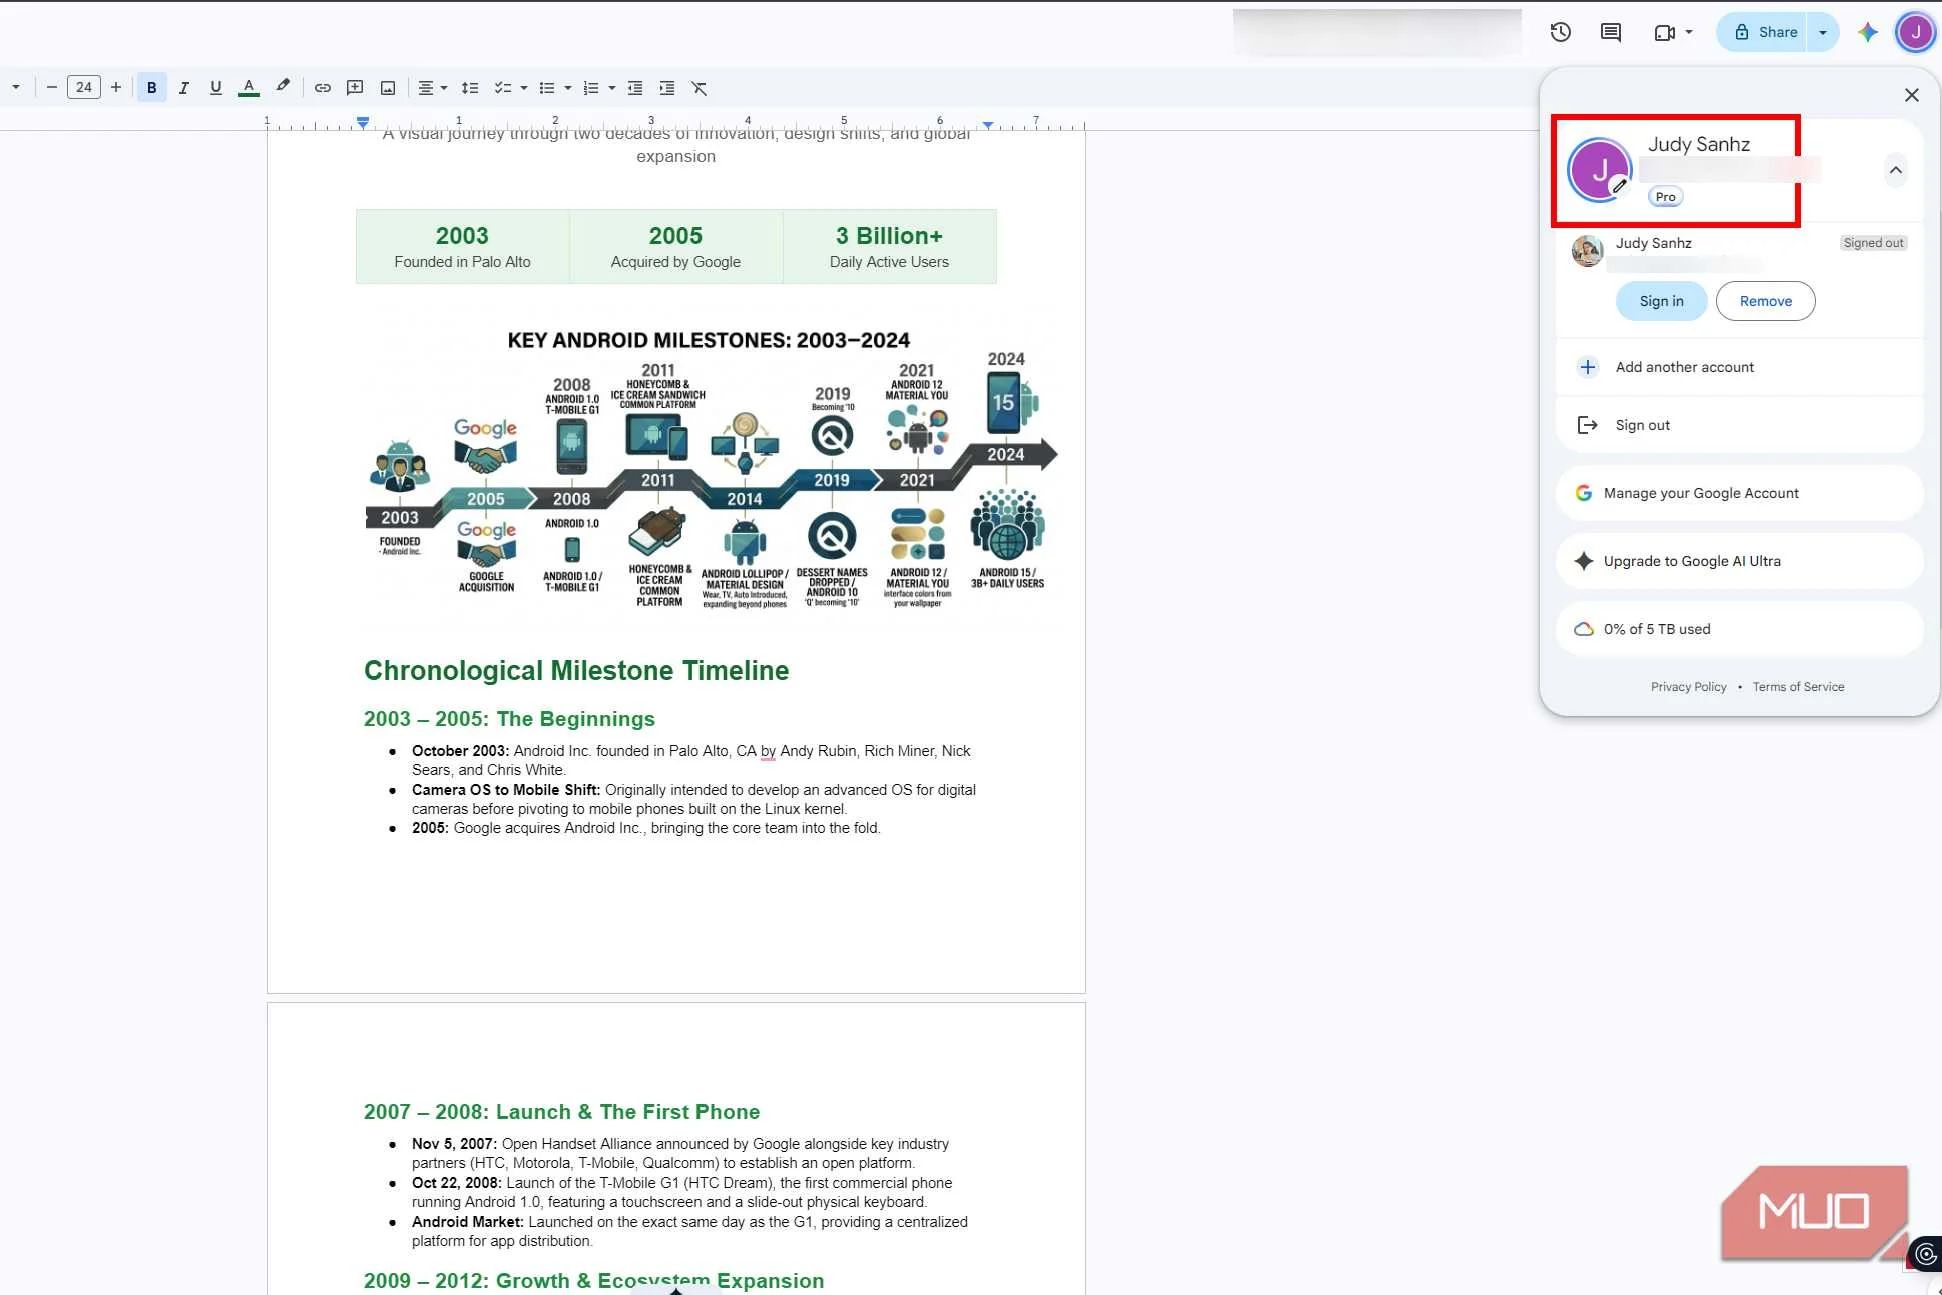
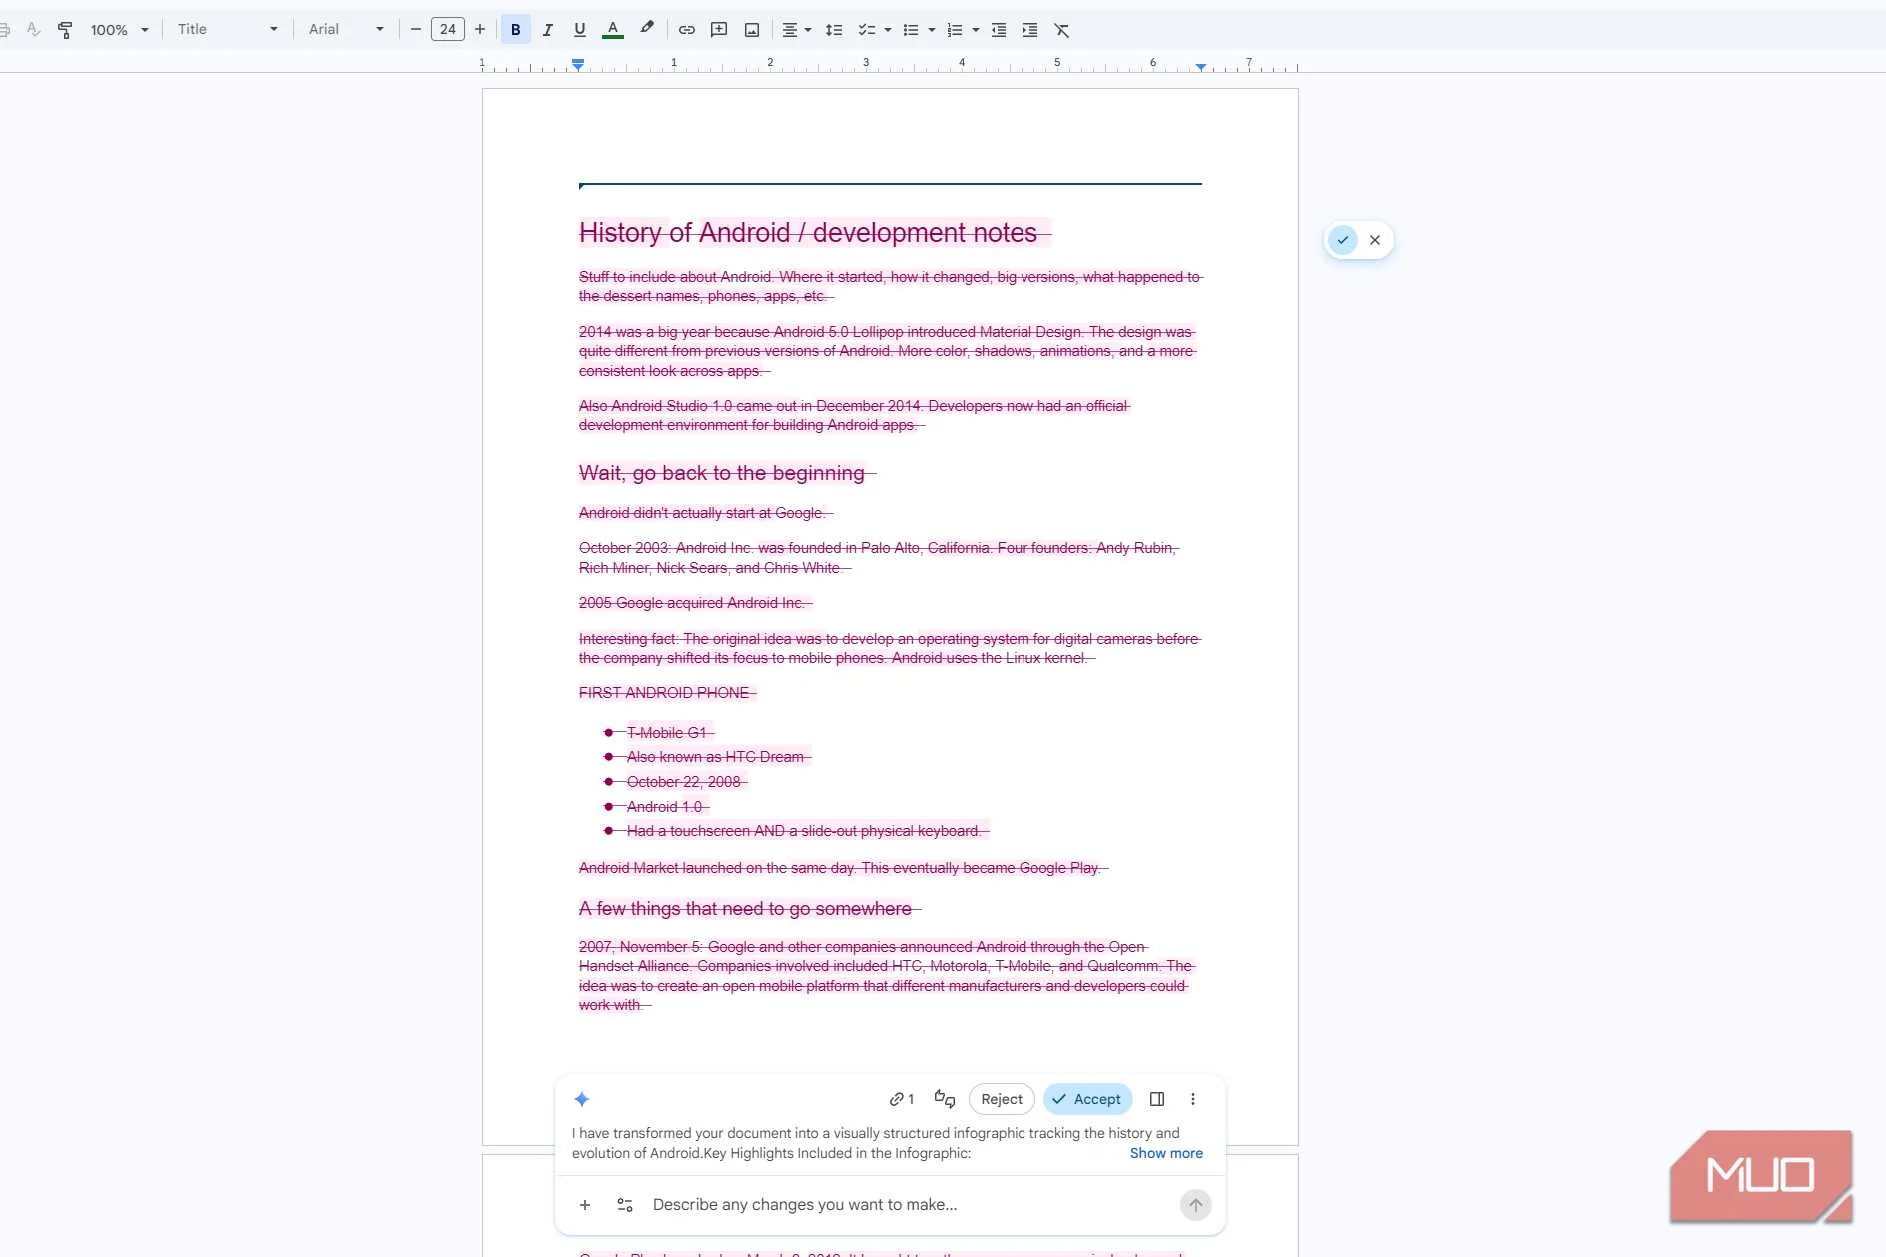
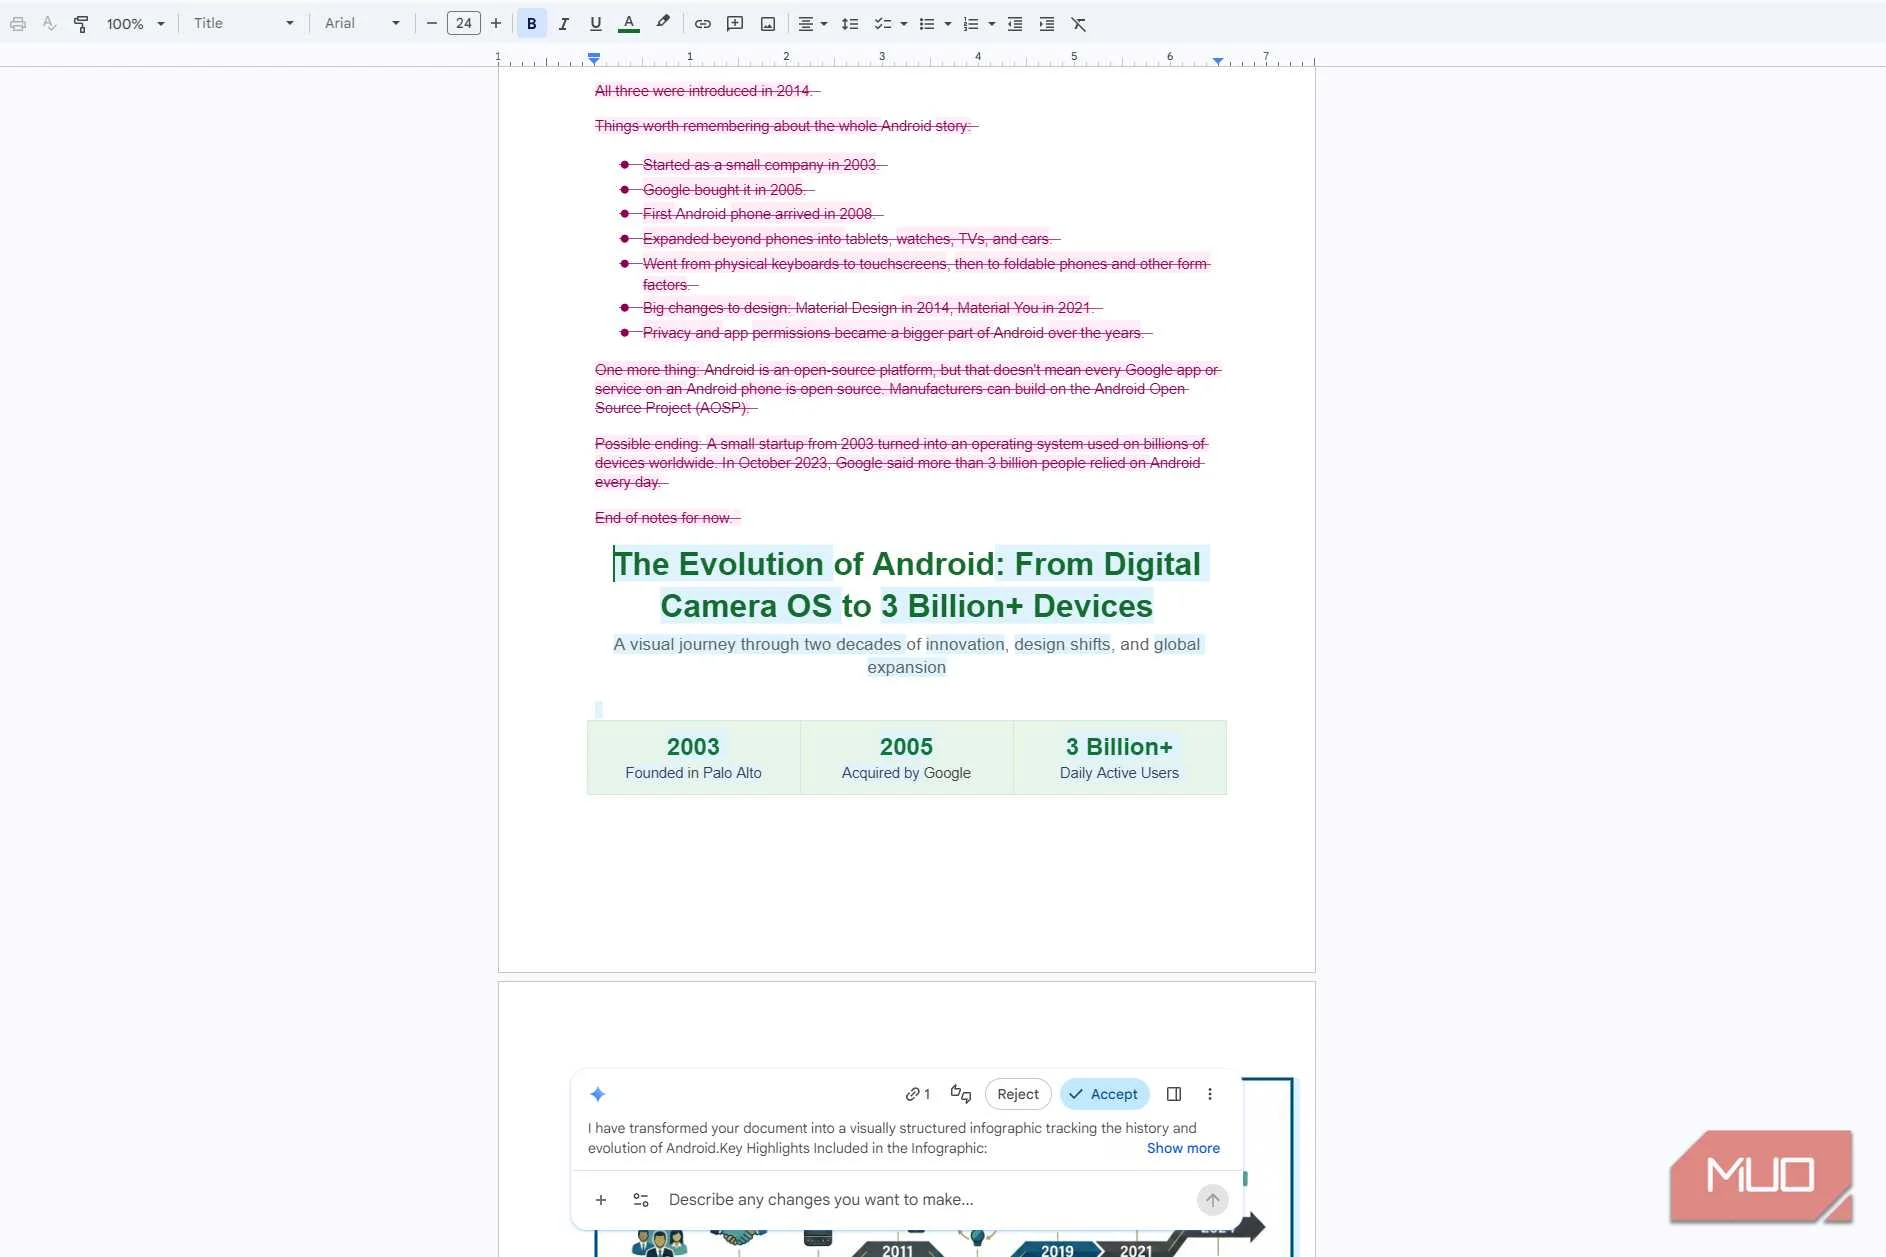
Gemini’s version of my Doc ran from 2003 to 2024, with everything in order. It even sorted the Android dessert names, which I’d left a reminder to do myself. Before you accept, Gemini shows you that it’ll cross out your original notes and replace them with its version.
Make a copy of your Google Doc before accepting Gemini’s changes, just in case it takes out more information than you’d like.
I left the design up to Gemini
The pictures did some of the explaining for me
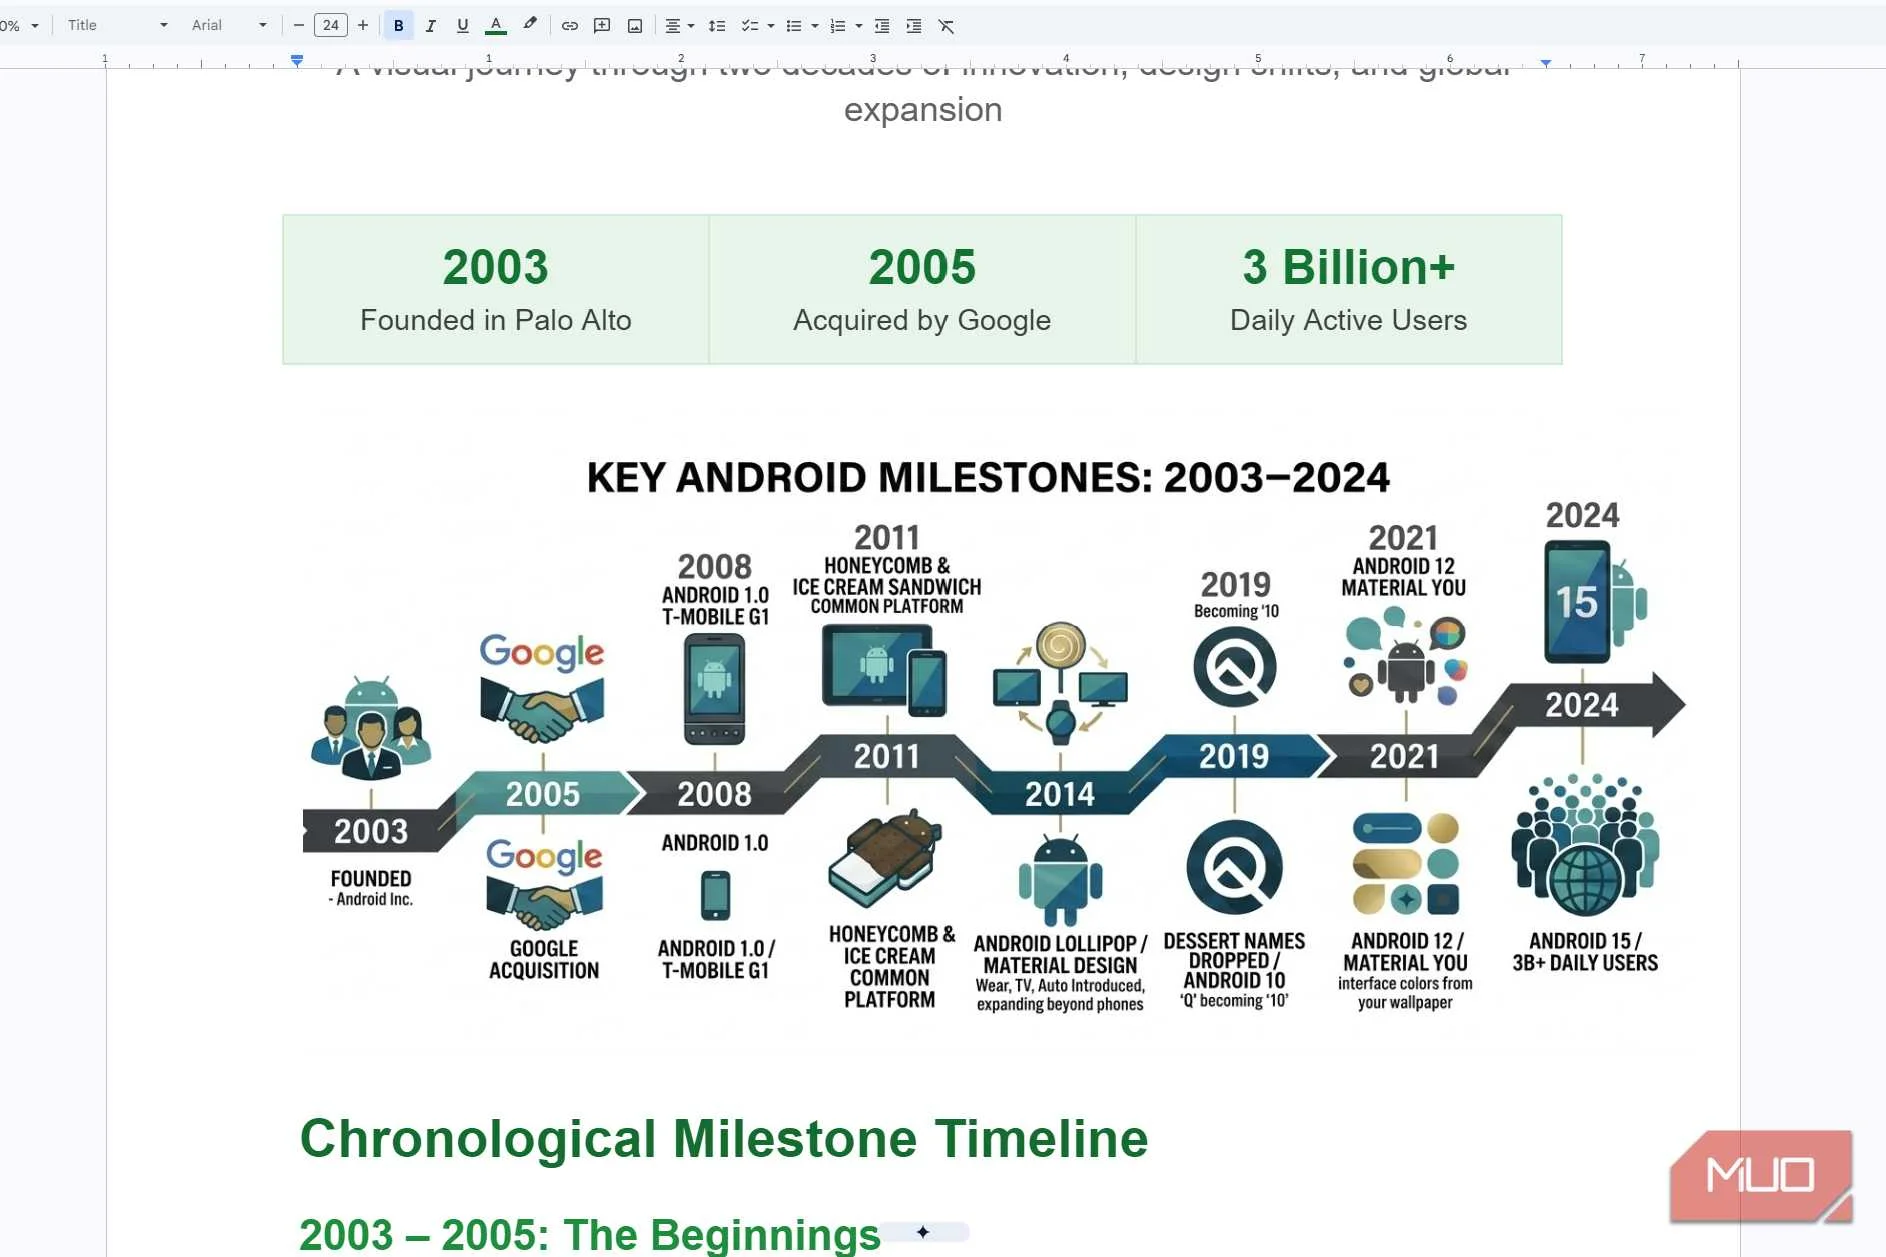
You don’t have to know what you want your infographic to look like to get started. I wasn’t sure what I wanted mine to look like, so I let Gemini decide and worked my way from there. That beat sitting there staring at my screen trying to come up with something myself.
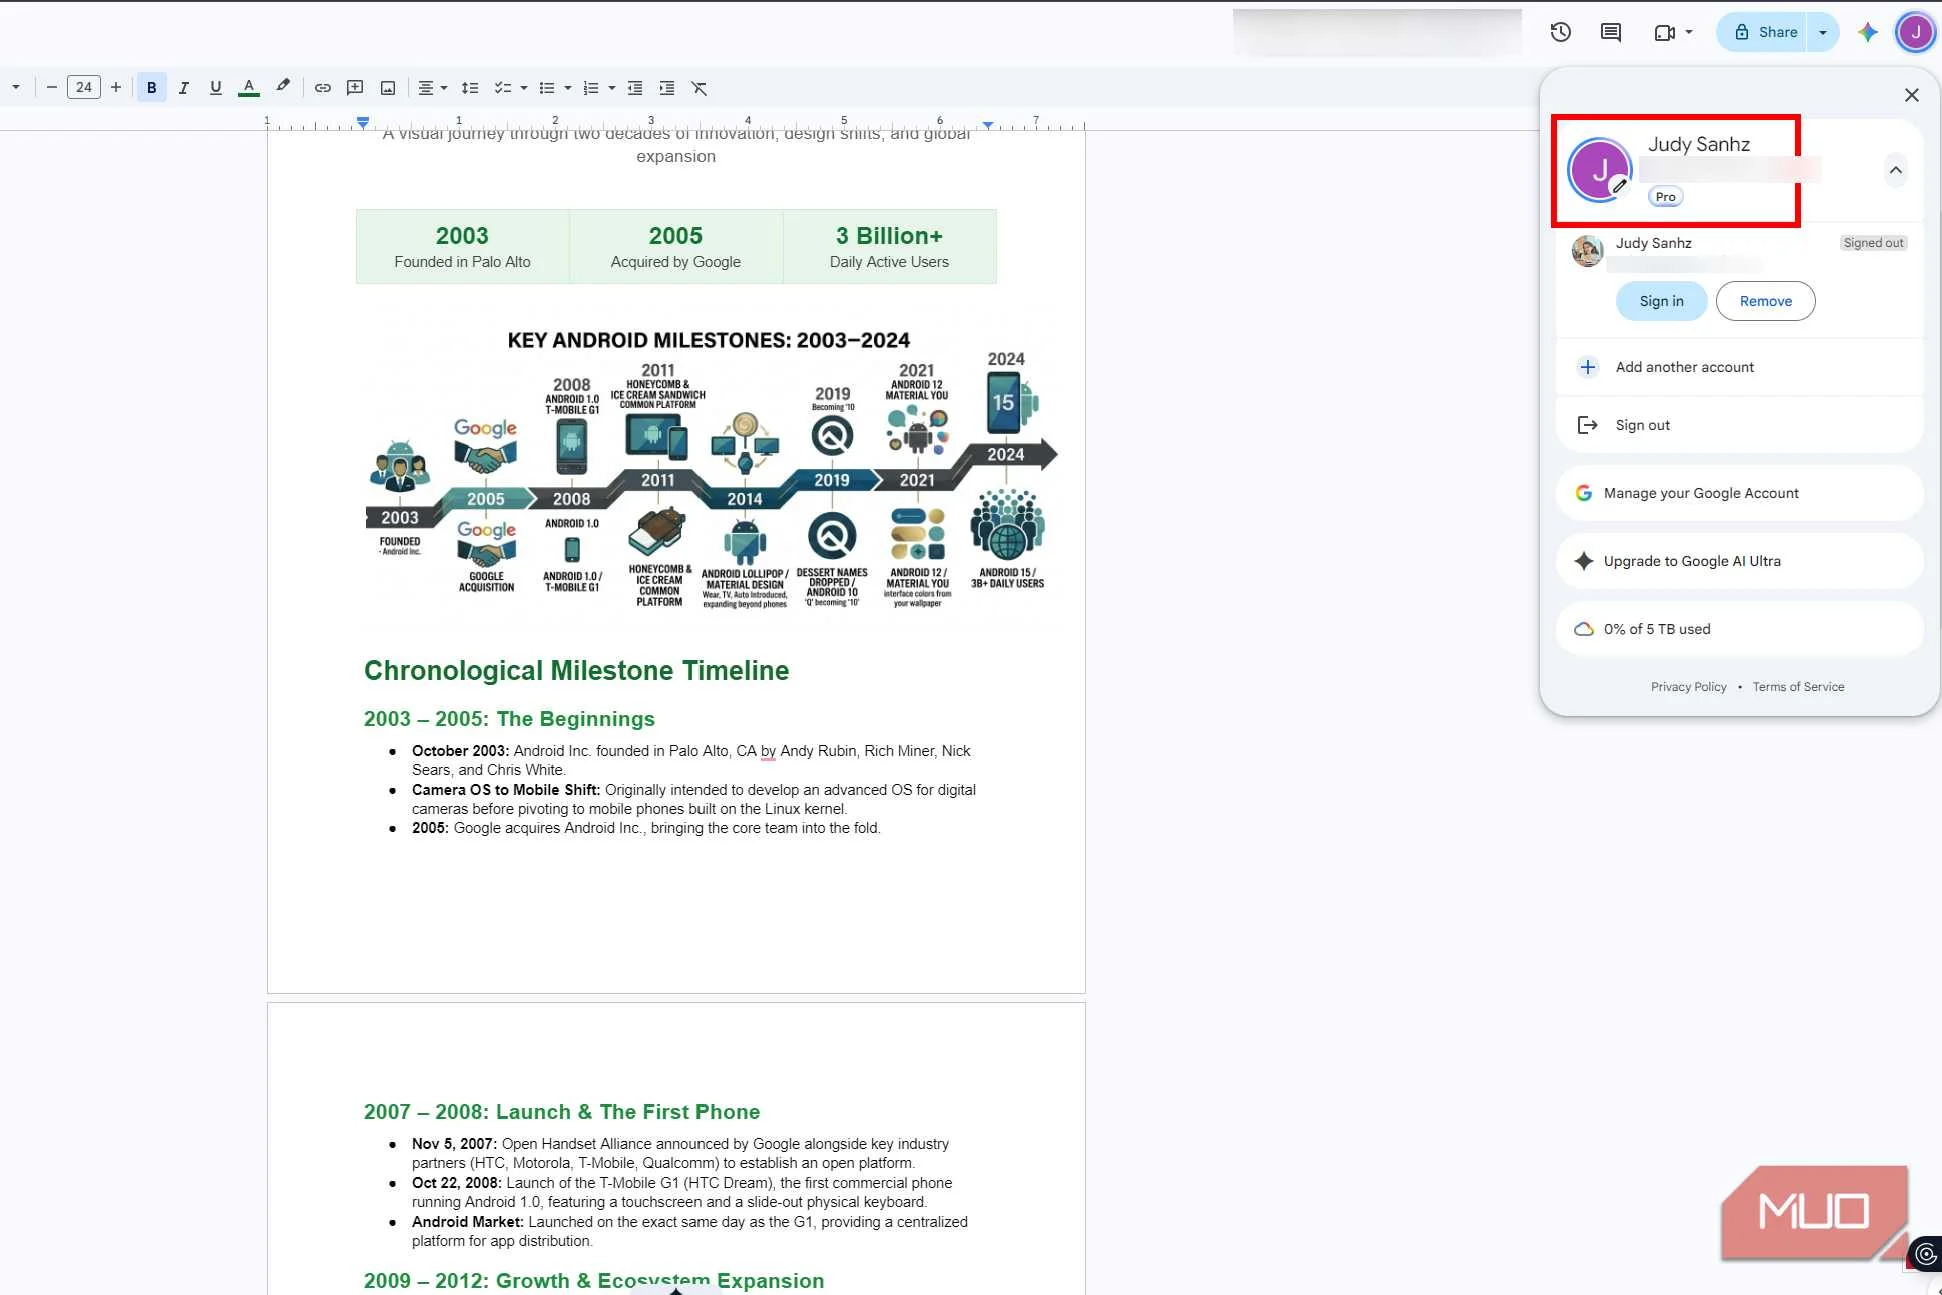
I liked that Gemini used illustrations that went with what was happening. For example, it used a handshake to represent Google's acquisition of Android, with a short description underneath. The years were easy to find, and the little arrows showed me where to look next. Gemini didn’t try to squeeze every bit of information from my Doc into the infographic, either. Even if all that information was useful, it would’ve been too much to take in at once.
The infographic gave me a good idea of how Android has evolved over the years. If something caught my attention and I wanted to know more, I could scroll down to the more detailed information Gemini included below.
I could change the infographic without starting over
I didn’t even need another prompt
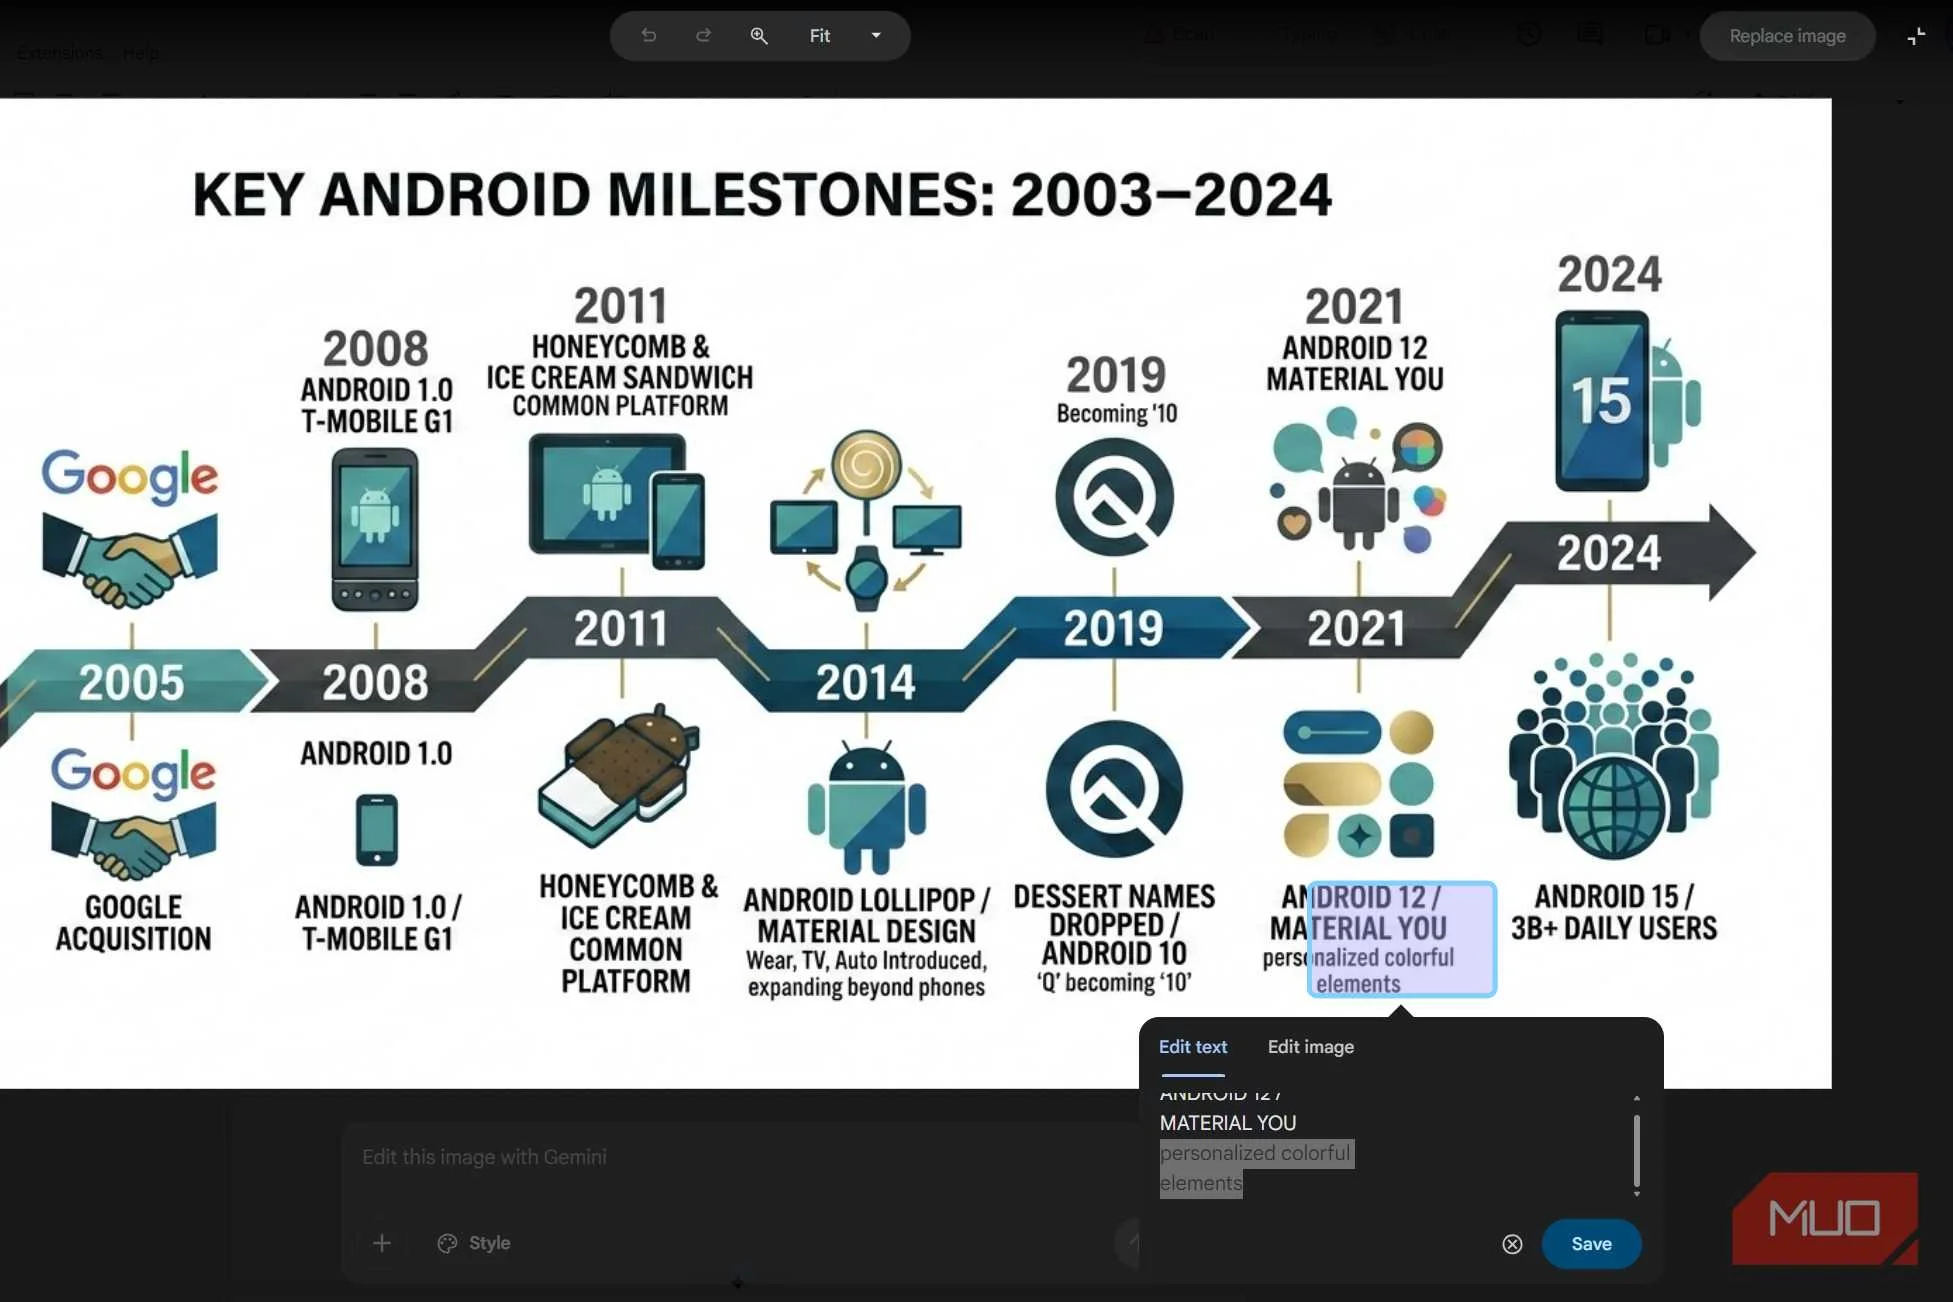
If there’s only one part of your infographic you don’t like, you can fix it without having to create another one. Let’s say you’re happy with the design, but there’s a description that could use a little more detail. You can change that specific part to add the finishing touches.
That was the case with the Android 12 Material You section of my infographic. Gemini used the words “personalized colorful elements” to describe the feature, but I wasn’t sure what it meant. I wanted to make it clearer that your phone uses colors from your wallpaper for things like buttons and menus.
I clicked the infographic, followed by Edit, and selected the text I wanted to change. Gemini gave me two options: Edit text and Edit image. I went with the first one and changed the description to “interface colors from your wallpaper.” After clicking Save and Replace image, I had my new description, and the rest of the infographic looked the same. No need to come up with another prompt.
Gemini skipped a few things I wanted in there
Only three dessert names made the cut
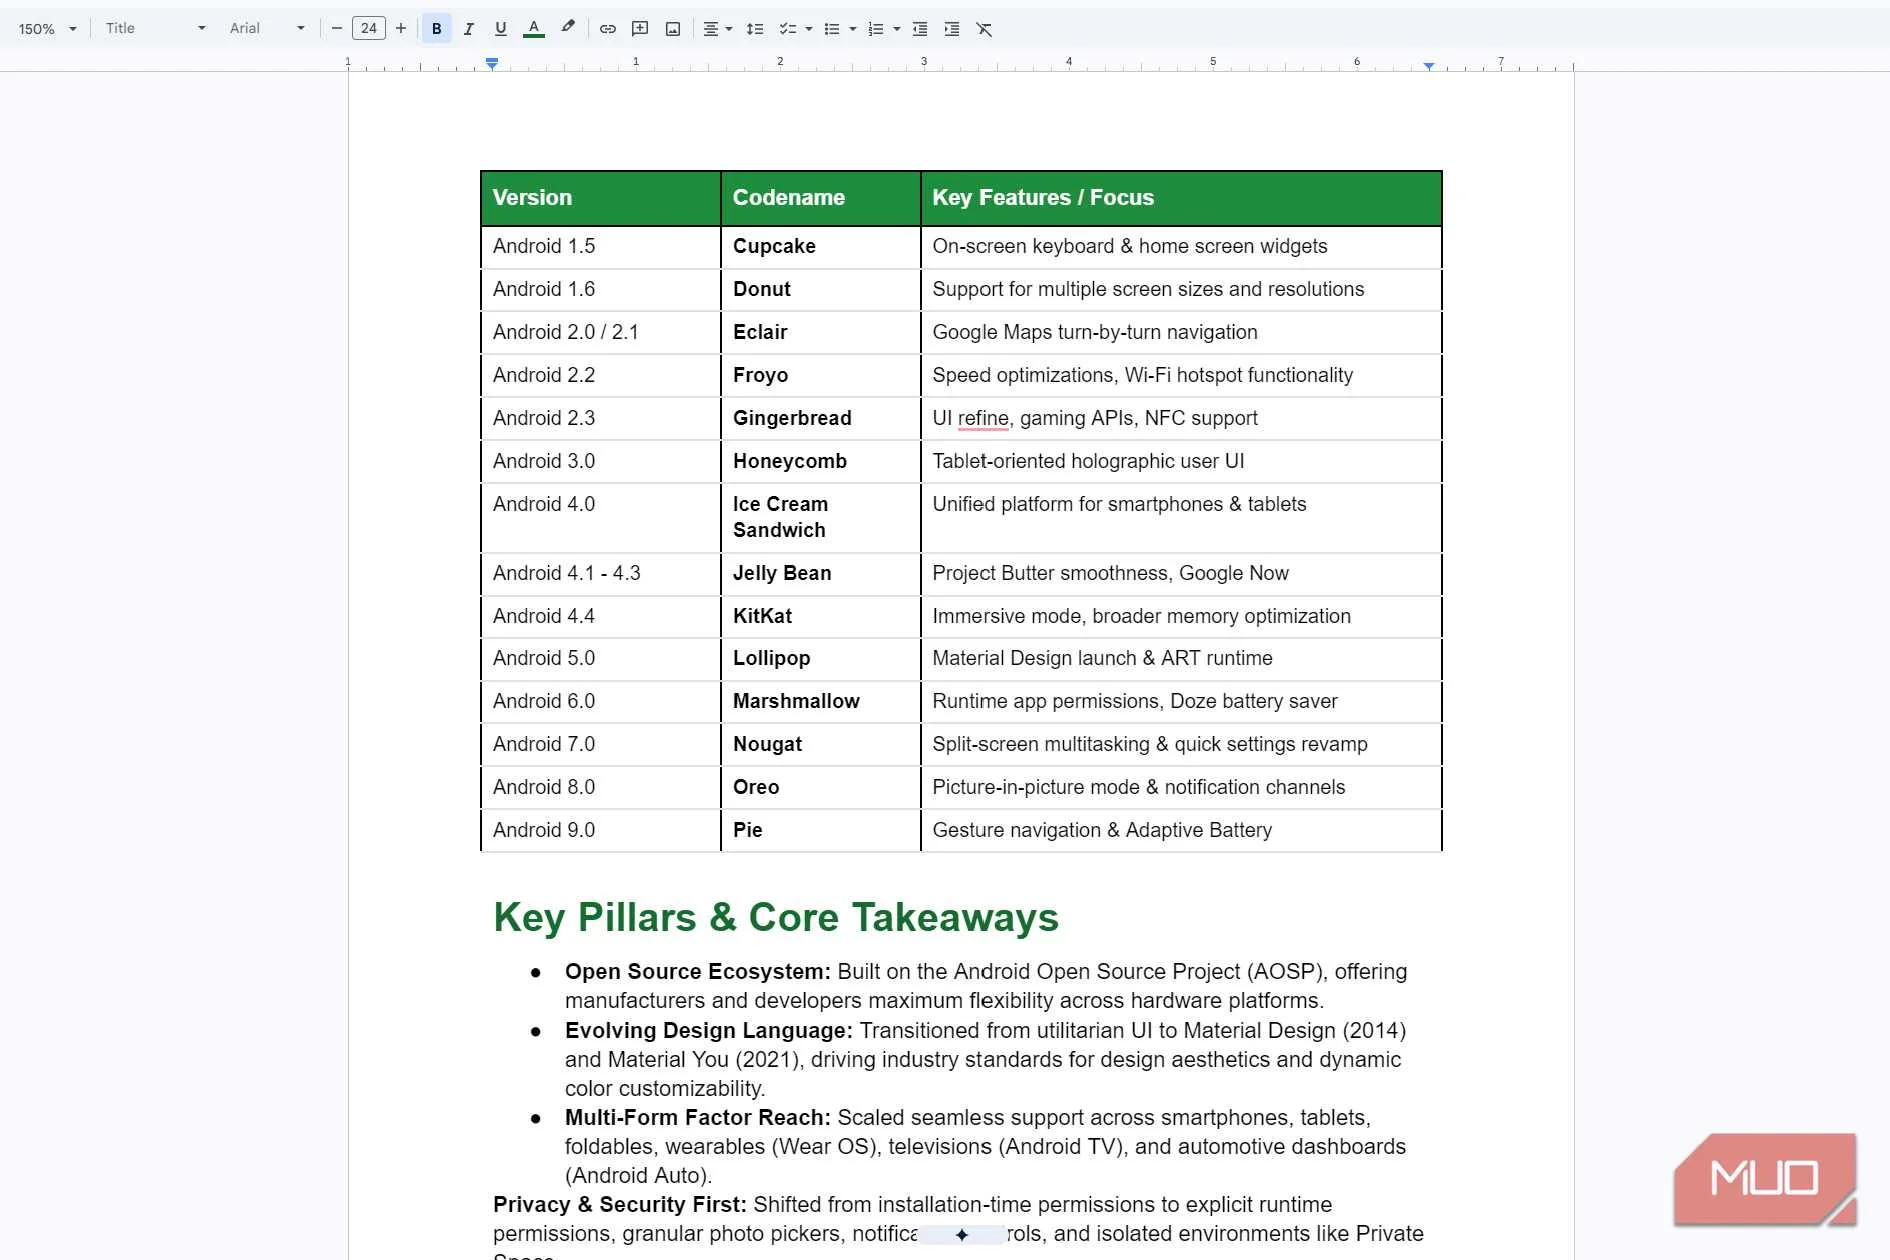
Gemini can leave out information you’d like your infographic to include. I wasn’t expecting a whole story for each release, but showing only two Android dessert names felt a little too simplified. Mine only showed Honeycomb and Ice Cream Sandwich (2011) and Lollipop (2014), then said the names were dropped in 2019. The full list was in a table further down, but not in the infographic itself.
Gemini had room for more too, since the infographic repeated some milestones above and below the timeline, like the Google acquisition and Android 1.0. That space could've been used for a few more names.
It still beats making one from scratch
The missing names were in my Doc
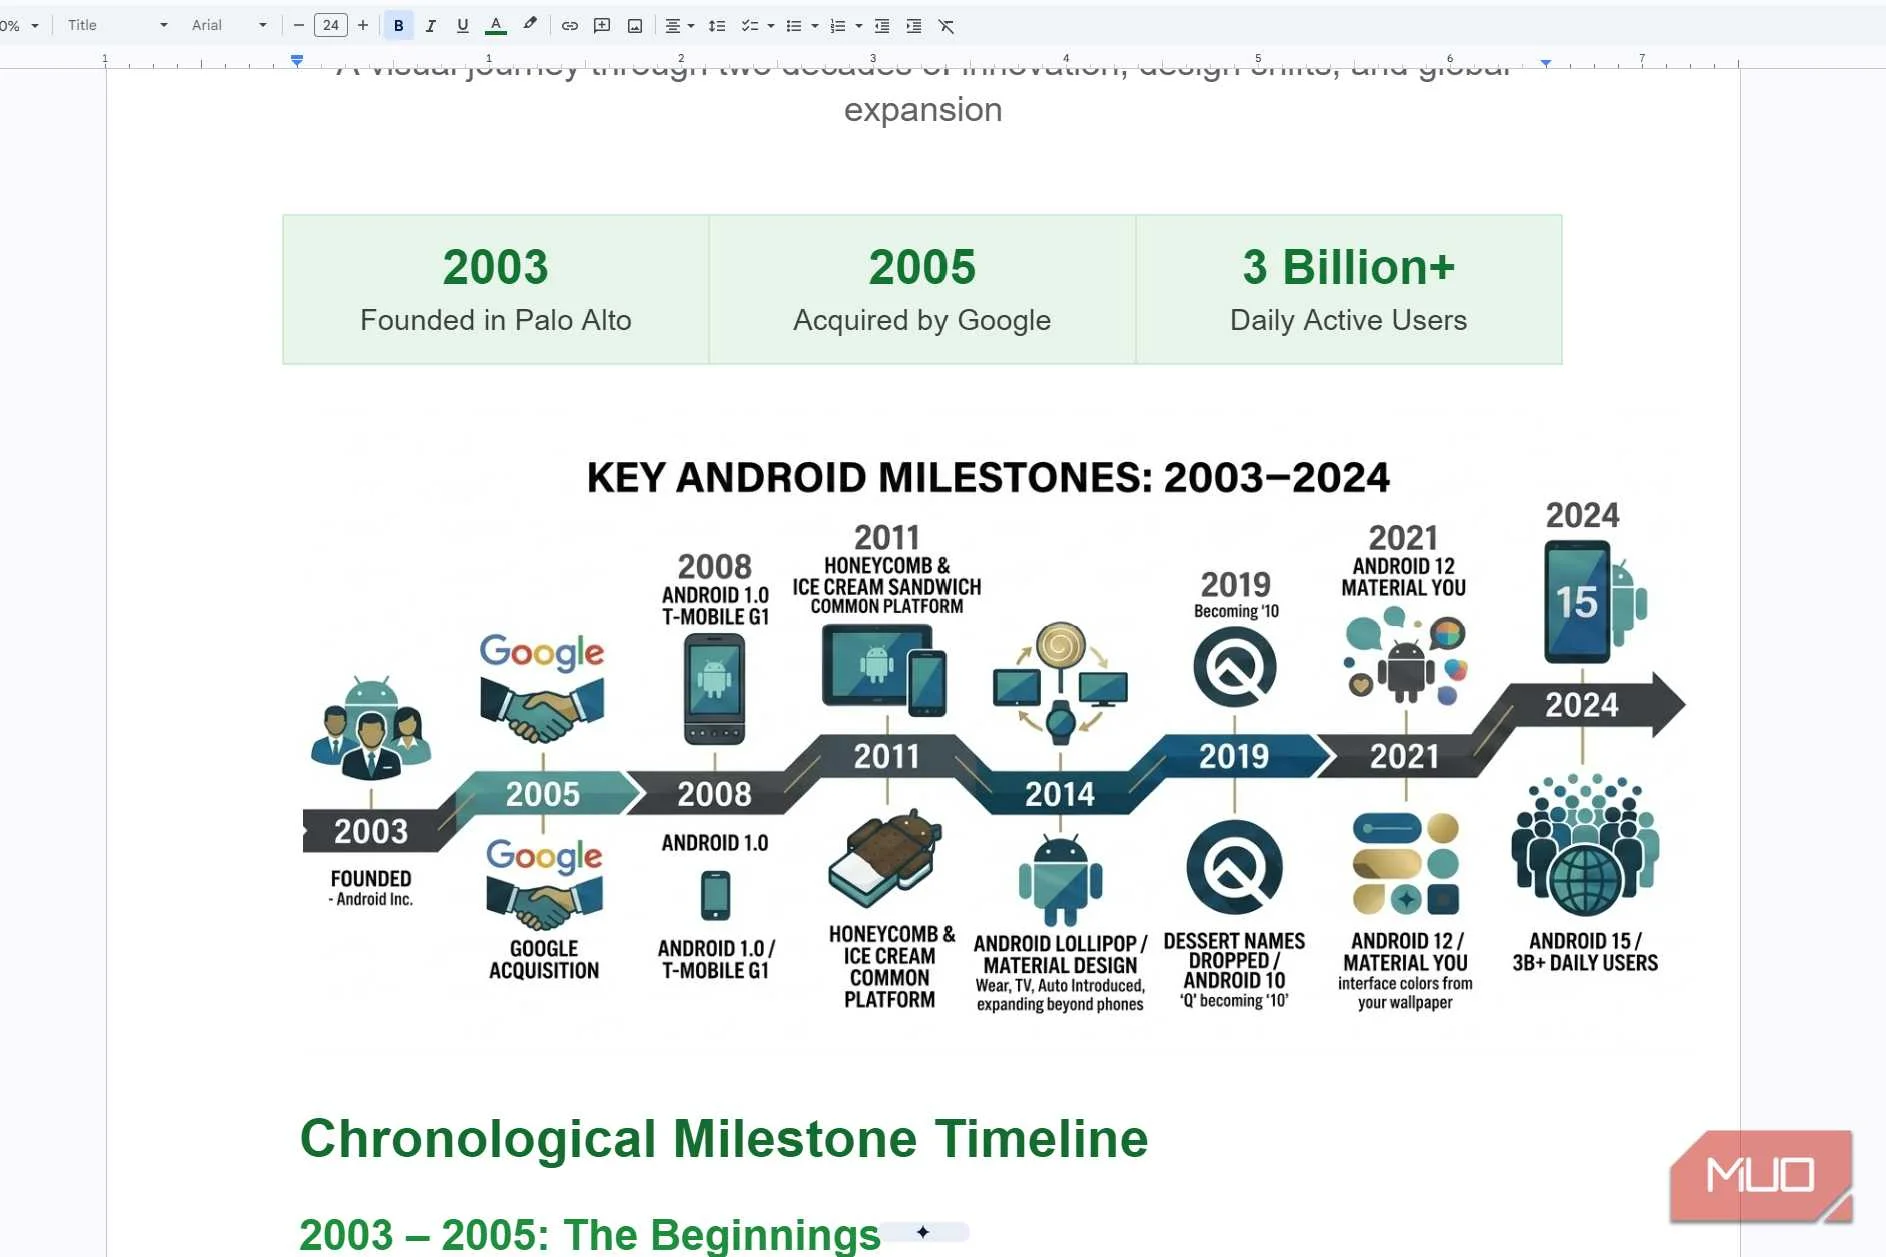
The infographic did leave out most of the dessert names, but the full list was on the table right below. And if you’re not good at making infographics, Gemini still gives you one you can work with. Even with that omission, it saved me a lot more time than making one myself.
Your Google Doc doesn’t have to be perfect to be useful
You don’t need a perfectly organized Google Doc to get something useful out of it. That’s the whole point of using Gemini in the first place. It can give you a decent infographic to start with, so you’re not stuck sorting through your notes and trying to design it yourself. Sometimes you just need a first version to know which direction you want to take.
That doesn’t mean you should share whatever Gemini hands back. Check the facts, look for anything important it might have skipped, and fix what doesn’t make sense. If you already have access to Gemini in Google Docs, try it with some notes you’ve been meaning to organize.